PyMOL Colors and Visualization: color by chain, secondary structure, and custom schemes
How to color and modify the appearance of your system in PyMOL
PyMOL’s default colors and representation styles are rarely what you need for a publication figure. This article covers the core commands for changing colors, transparency, and the size and style of cartoon, sticks, and sphere representations.
Adjust Color in PyMOL
The first basic operation that you may want to achieve in PyMOL is to change the color of your system.
The most straightforward way to do so is to use the object menu panel by clicking on C → select the color. You will have the possibility to select a specific color as well different coloring schemes such as color by chain or secondary structure.
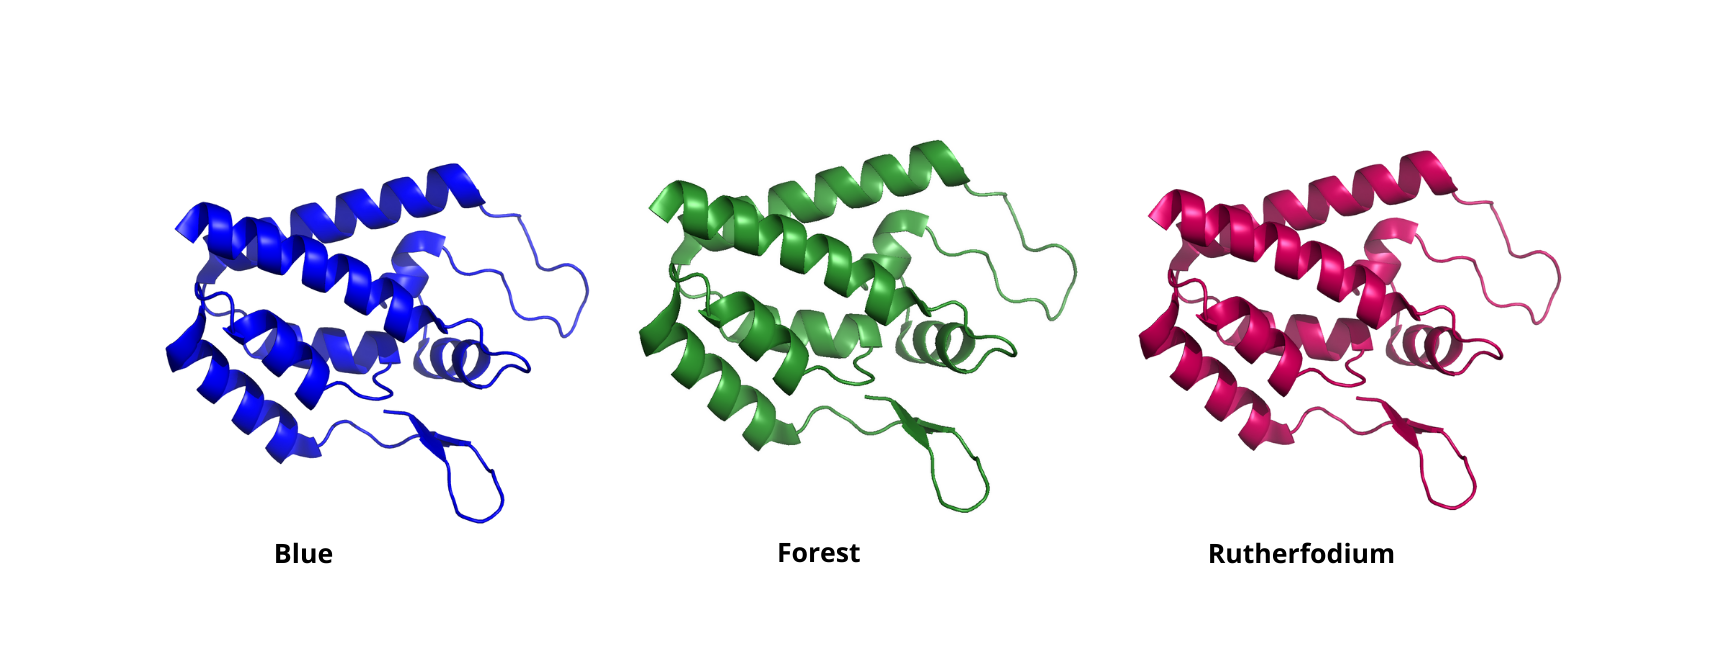
As always, the second option is to use the color command followed by the name of the color you need. For instance, to color a molecule red, you simply need to type:
|
|
PyMOL provides you with a wide range of colors including standard options as well as more “exotic” choices. You can access all the colors available in PyMOL and their corresponding names here.
To achieve more control over the coloring process PyMOL gives you different options. Here, we will explore a few of the most common.
Change the color of a PyMOL representation
To change the color of a specific representation we can use the set <representation>_color command.
|
|
For instance, if you want to change the color of your cartoon representation to blue you can use the command:
|
|
Change the color of a selection of atoms
To alter the color of a specific subset of atoms, use the color command followed by a selection of atoms (my_selection). Find more info on the PyMOL selection tool here. Some examples are given below.
|
|
To change the color of the $C_{\alpha}$ in your protein to yellow:
|
|
Color $N$ atoms blue:
|
|
Change the color of a chain (chain A) to green:
|
|
Color the alpha helices in red:
|
|
Advanced coloring options
Here we will explore a couple of advanced coloring options available in PyMOL.
Let’s say that you want to color your system by atom type. Sure, you could do this by manually assigning each element to a different color but this can be tedious and time-consuming.
A more efficient approach is to use the built-in PyMOL command util.cba (“Color By Atom”) which can be used to color atoms based on their atom type. This is a useful tool for visualizing the different chemical components of a molecule.
Specifically, oxygen atoms will be displayed in red, nitrogen atoms in blue, and hydrogen atoms in white. To set the color for carbon atoms, you can specify a letter code at the end of the command.
For example, to color carbon atoms green, you would add the letter “g” (cbag) in the command (yellow “cbay”, cyan “cbac”,…). You can also use a selection to color a certain part of the system.
|
|
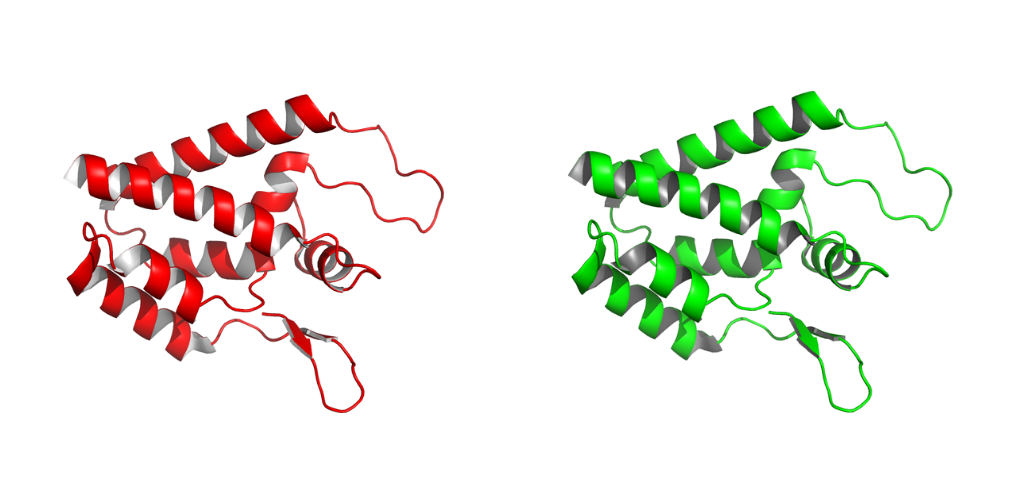
Another common option is one that you may have seen in a few papers and consists of a cartoon representation where the interior part of the helix has a different color.
To achieve this you can use the set cartoon_highlight_color command followed by the name of the color. Generally, the inner part of the helices is reported in grey but as usual, you can play with the customization as you wish.
|
|
Modify the transparency in PyMOL
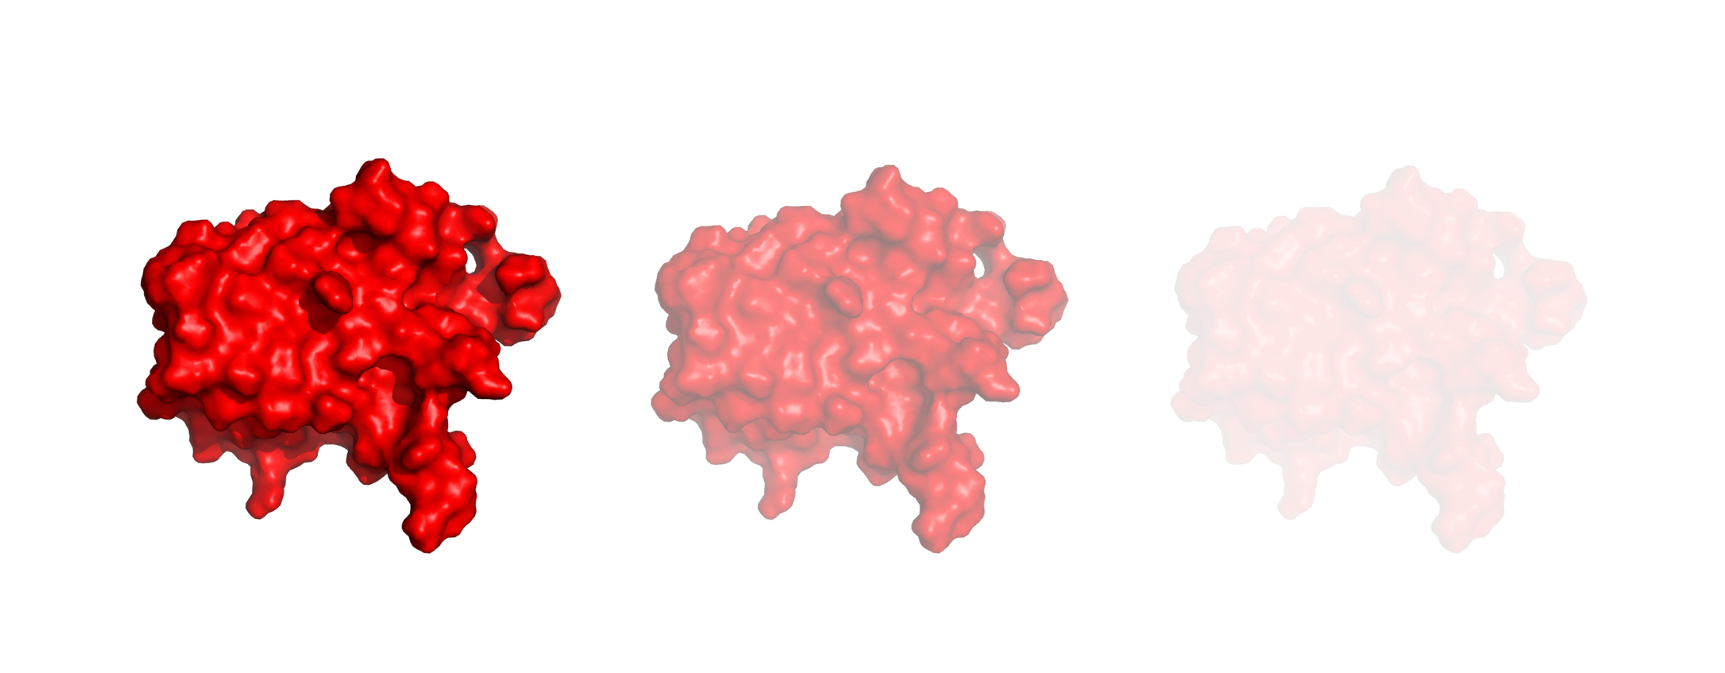
PyMOL offers the possibility to modify the transparency of your system or particular regions with the set transparency command. The syntax is as follows:
|
|
The <transparency_value> is a number ranging from 0 to 1, with 0 being completely opaque and 1 being completely transparent. Optionally, you can also decide to apply the transparency to a specific part of your system by using a selection (<selection>).
It’s important to note that the transparency needs to be adjusted with different commands depending on the object representation.
We have four commands:
- Surface:
set transparency, <transparency_value> (,<selection>) - Cartoon:
set cartoon_transparency, <transparency_value> (,<selection>) - Spheres:
set sphere_transparency, <transparency_value> (,<selection>) - Sticks:
set stick_transparency, <transparency_value> (,<selection>)
Here is a brief illustration to show how transparency changes moving from 0 to 1. From left to right we have.
|
|
Adjust the scale and style of objects in PyMOL representations
Another possible customization you may want to accomplish in PyMOL is to adjust the scale or style of different representations.
In this article, I will suggest you a few useful modifications for the cartoon, sticks, and spheres representations.
Set the style of the cartoon representation
The cartoon representation is a popular tool for visualizing the overall shape and structure of a protein in PyMOL.
Different cartoon styles are available in PyMOL and they can be changed by using this command.
|
|
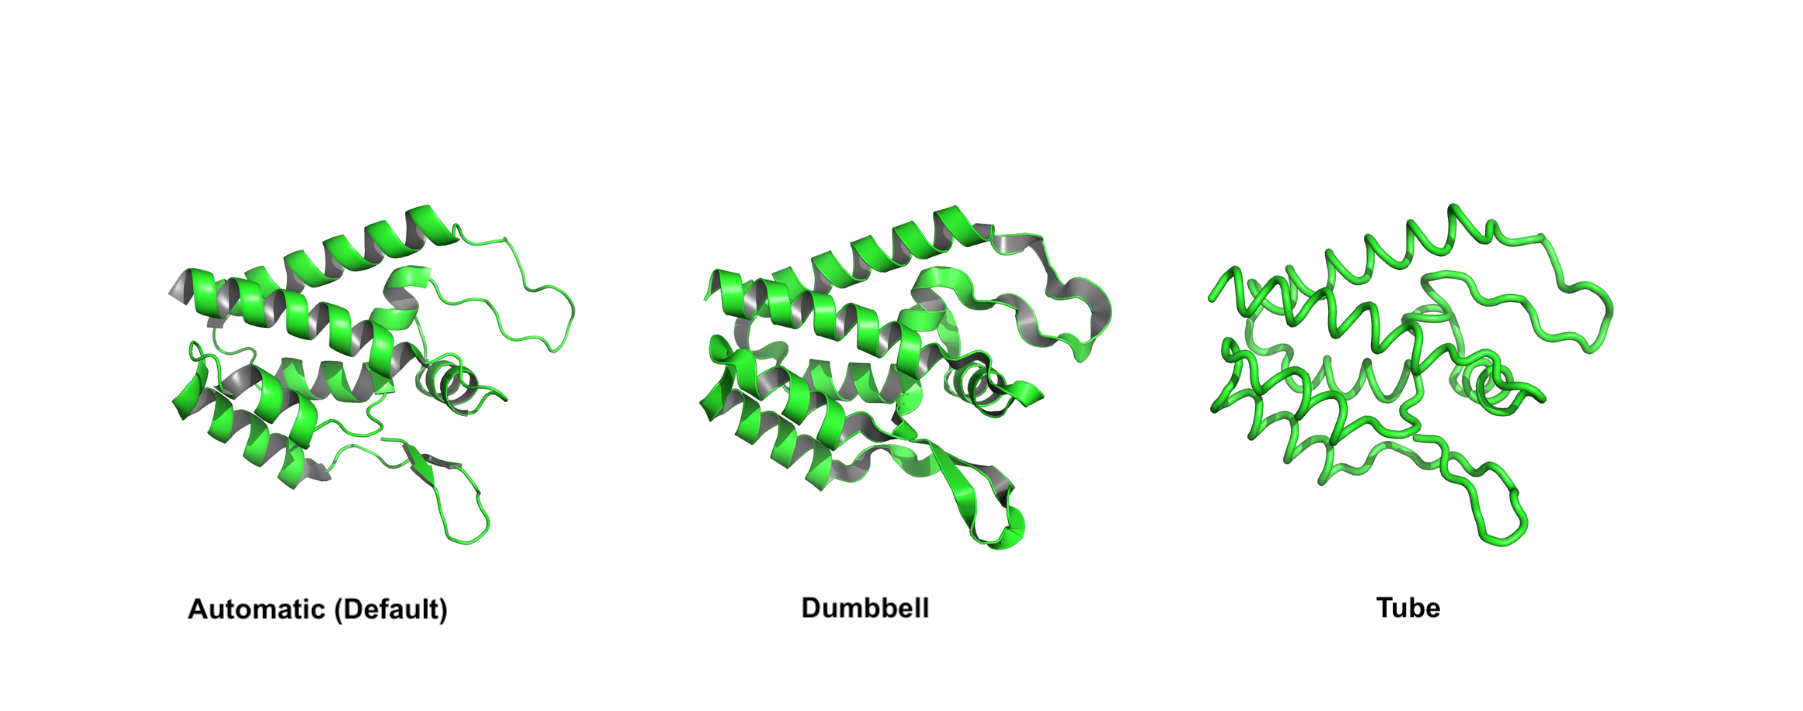
There are several <style> keywords that you can use:
automaticlooprectangleovaltubearrowdumbbell
Feel free to customize your protein as you prefer. As always, remember that you can pass a selection to apply the changes to a restricted group of atoms.
Some of the styles (automatic, dumbbell, and tube) are reported in the image below.
|
|
- A very useful trick is to turn on the fancy helices with the
set cartoon_fancy_helicescommand followed by1.
|
|
This will display them with tubular edges making them more visually appealing.
If you don’t like what you see you can always turn them off like this:
|
|
- You can also display the helices as cylinders with the
set cartoon_cylindrical_helicescommand. This option comes with three modalities0(no cylinder),1(curved cylinders),2(straight cylinders).
|
|
Adjust the size of a cartoon representation
The cartoon representation is composed of three main elements: alpha helices, beta sheets, and loops.
We can modify the width and the thickness of each of the three components using different options followed by a numerical value (hereafter referred to as <value>) that it’s up to you to decide.
To change the appearence of the $\alpha$-helices you can use:
|
|
For $\beta$-sheets we have:
|
|
The radius of the loops can be modified with:
|
|
To modify the dimensions of the fancy helices you will need to use other commands:
|
|
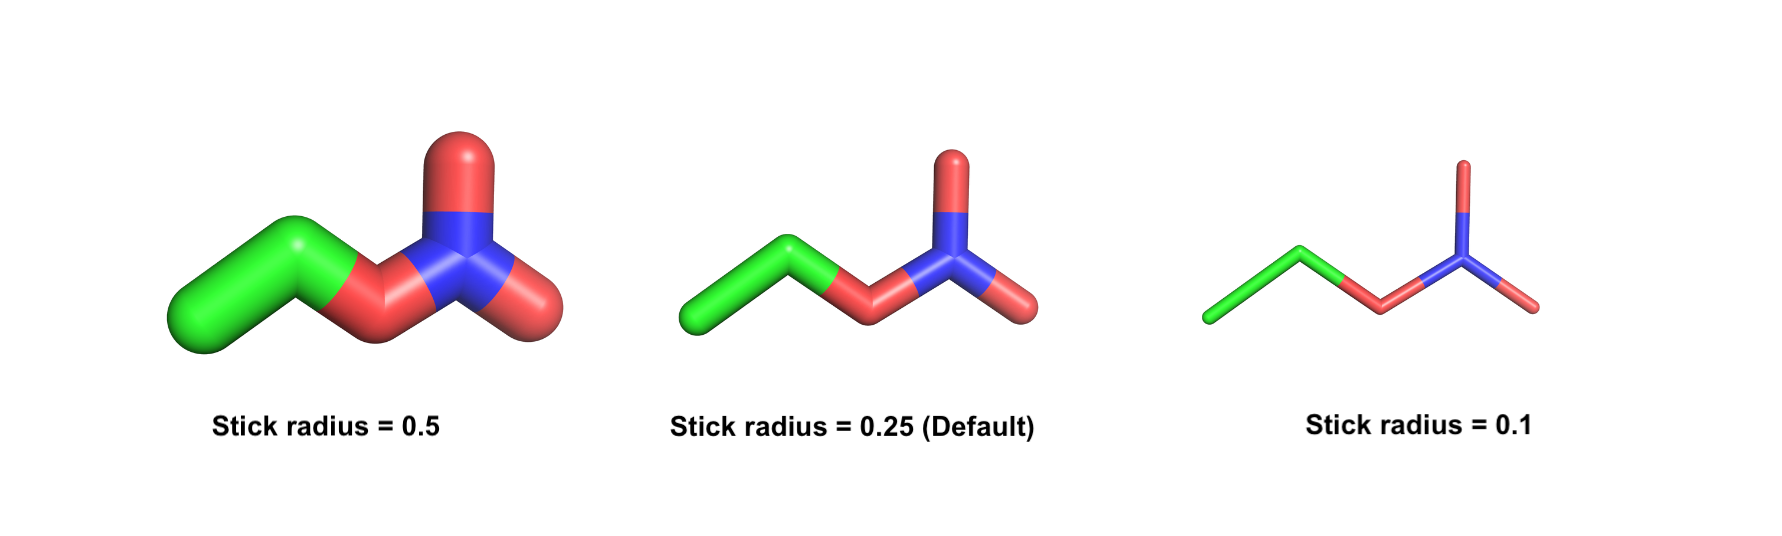
Set the radius of the sticks representation
The stick representation in PyMOL is a useful tool for visualizing the detailed atomic structure of a molecule.
The radius of the sticks can be adjusted using the set_stick_radius command, which allows you to change the size of the sticks. You can do that for the overall system or a certain selection.
|
|
The default value of the scale is 0.25. You can increase it to have thicker sticks and vice versa.
|
|
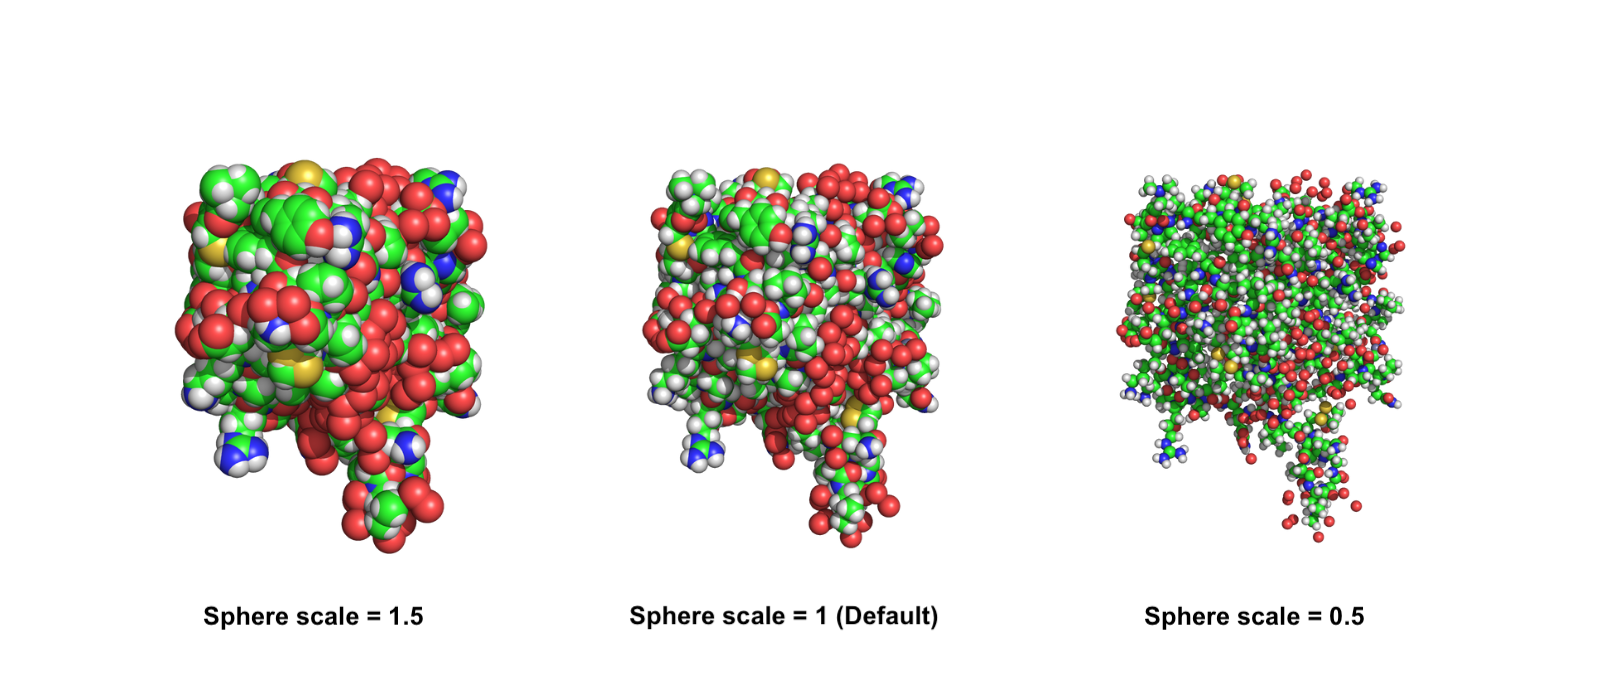
Set the scale of the sphere representation
The scale of the sphere representation can be adjusted using the set_sphere_scale command, which allows you to tailor the size of the spheres to your needs creating a more informative or visually appealing representation. As always, you can decide to pass a selection to modify the scale for a certain group of atoms.
|
|
The default value of the scale is 1. You can increase it to have bigger spheres and vice versa.
|
|
Color by Residue Number or RMSF with spectrum
The spectrum command applies a gradient color scale across a property. The most common use is coloring from N to C terminus to show chain directionality:
|
|
A more informative option is coloring by flexibility. If you have computed the RMSF with GROMACS, you can write the fluctuation values directly into the B-factor column of a PDB file using the -oq flag:
|
|
Load bfac.pdb in PyMOL and apply a color gradient based on the B-factors:
|
|
Residues colored red are the most flexible; blue regions are rigid. This makes spectrum b a direct visual counterpart to the RMSF plot.
For an even stronger visual, combine it with the putty representation, which scales tube thickness by B-factor value:
|
|
Flexible regions will be both red and thick; rigid regions blue and thin.