PyMOL Tutorial for Beginners: load, visualize, and customize protein structures
How to use PyMOL: A beginner's guide
Molecular visualization programs have become extremely valuable tools in many fields of science including computational chemistry and structural biology. They allow us to visualize and analyze the structure of molecules such as proteins, nucleic acids, and small organic molecules to a level of detail and customization that would be otherwise impossible to reach in a laboratory.
As of today, using a computer it is possible to download thousands of protein structures from dedicated websites (e.g., Protein Data Bank (PDB)) and use programs to visualize them, rotate their structure, zoom on the atoms of interest, calculate distances, everything in few easy steps.
Some of the benefits of using molecular visualization software include the general ability to improve our understanding of the 3D structure of molecules and therefore to identify the structural features essential to the functioning of the system. Another important point is the possibility to observe the dynamical evolution of the system obtained via Molecular Dynamics (MD) simulations. Lastly, they can be useful to generate high-quality images and movies for your publications or presentations.
In this tutorial, I will cover the basics of PyMOL, one of the most famous molecular visualization software available so that you can get a taste of its general functioning.
What is PyMOL?
PyMOL is a popular and open-source molecular visualization software with a user-friendly interface that allows you to observe molecular models and render high-quality images.
It established itself as a common tool in molecular graphics for scientists thanks to its wide range of features, strong and active online community, and availability on multiple platforms (Windows, Linux, macOS). The vast amount of functionalities is also a consequence of the fact that PyMOL was implemented in Python so it is easy for users to contribute with plugins and scripts and make them available online.
The software is now developed and maintained by Schrödinger, Inc. that offers a commercial version with support and more advanced options (Incentive PyMOL). Despite this, an open-source version of the program is also available free of charge for academic use and you can download the program for Windows, Linux, and macOS from the official website. So don’t worry if you don’t have a license because the free version should be fine for most research and educational purposes.
The Pymol Interface
When you open PyMOL the first thing you should see is an interface similar to the one reported in the image.
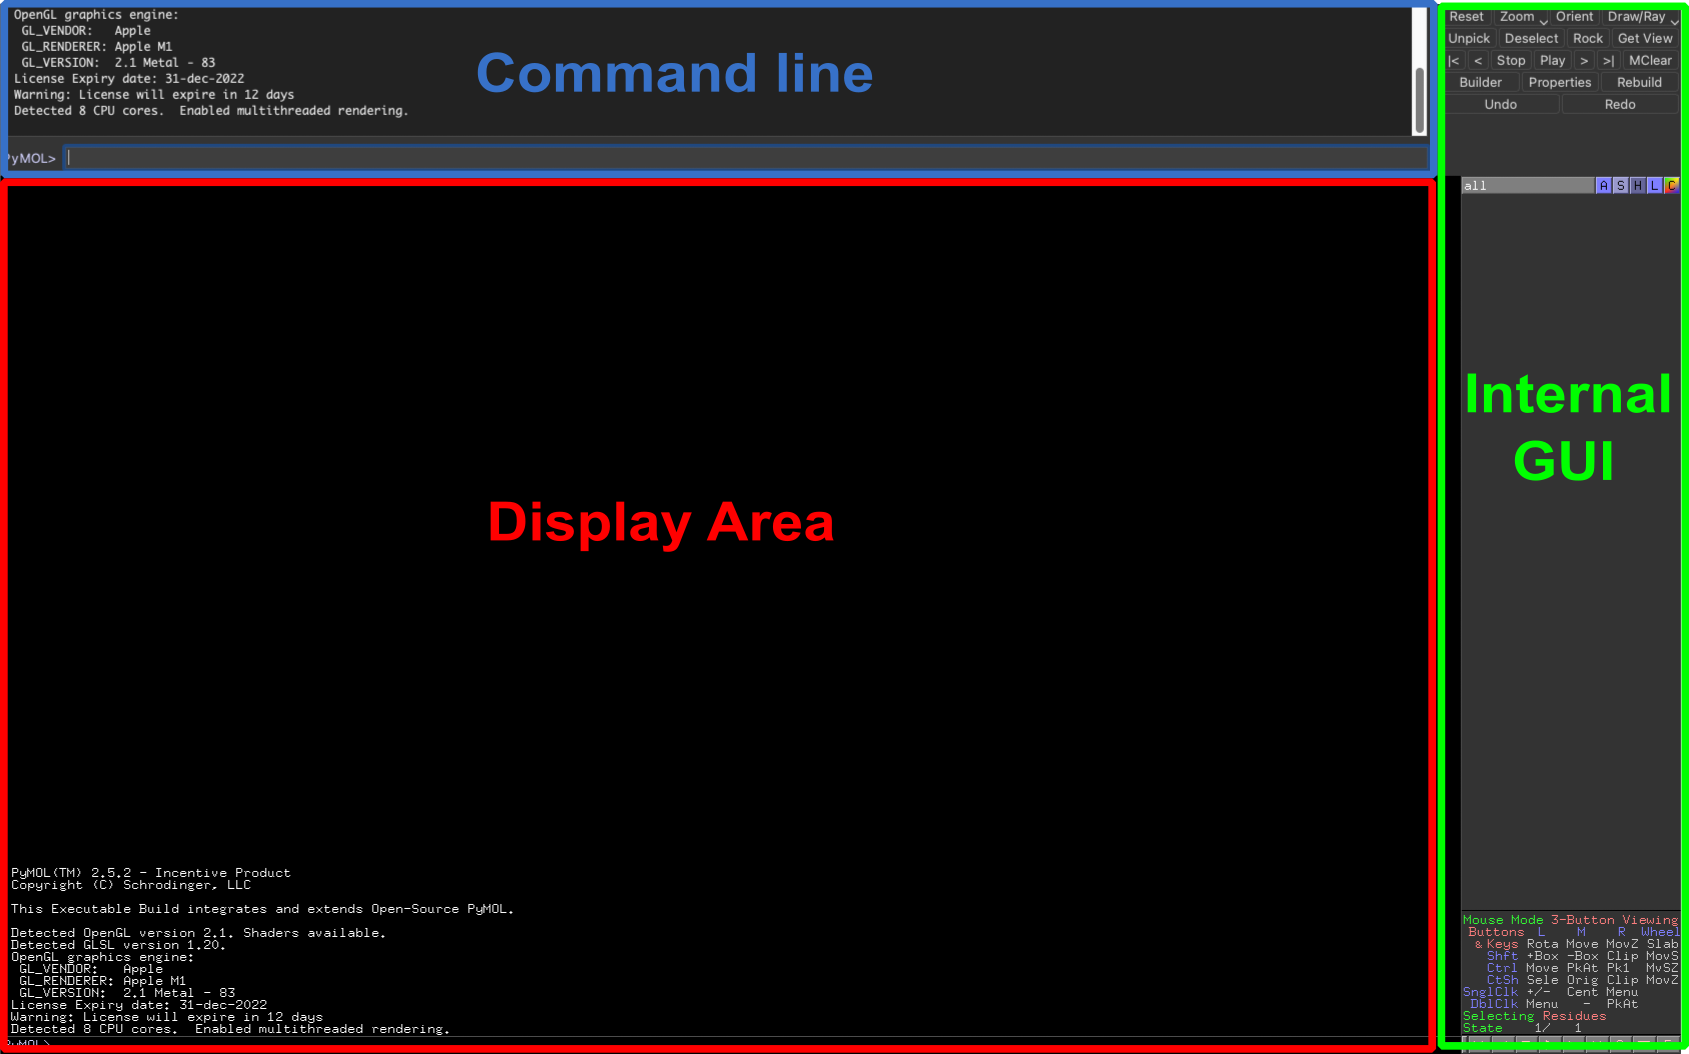
The layout consists of mainly three components:
- As the name suggests, the Display area is where the molecules will be displayed and manipulated once you load them in PyMOL. By default, you can rotate, zoom, and translate by dragging with your mouse (left button, right button, scroll wheel respectively) or trackpad (left button, right button, Ctrl + click).
- The Command line (or External GUI) is a text input field where you can enter commands to perform specific actions in PyMOL or run scripts. Keep in mind that you can also use the command line as a python interpreter as any command that is not recognized by PyMOL will automatically run in python. For example:
|
|
- The last component is the so-called Internal GUI which is divided into three panels. In the upper part, you can find quick access to a few common functions you may want to perform (red). The middle panel is the Object menu containing a list of the objects and selections loaded in the current PyMOL project (green). The bottom panel displays the mouse configuration and additional options to control the movie maker (blue).
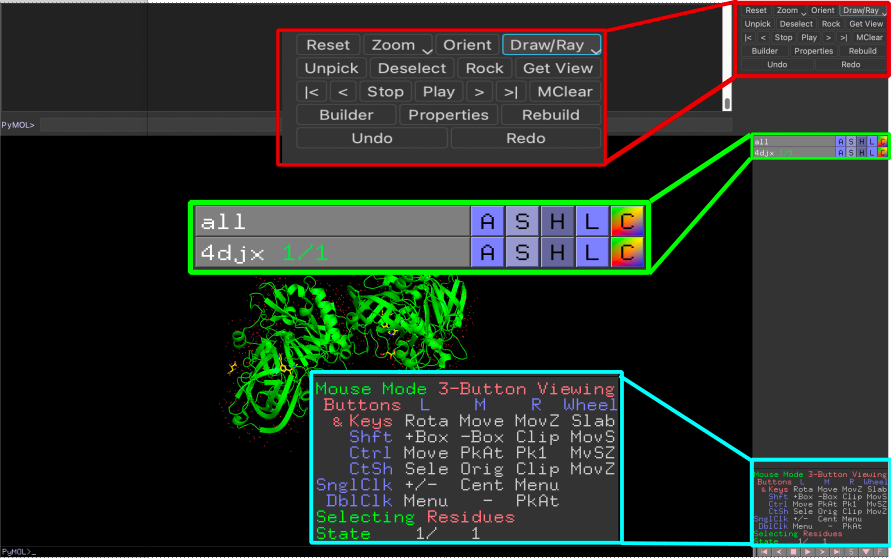
The Object menu panel contains an entry for each object and selection loaded into the current project and allows you to customize the visualization area. You can choose to display or hide from view a particular object just by clicking on its name. Furthermore, for each obejct/selection you have five pop-up menus that can be accessed by clicking on the letters:
A(Action): presets or actionsS(Show): show representationsH(Hide): hide representationsL(Label): show and create labelsC(Colors): color the objects
In PyMOL almost everything you can do with the command line can also be achieved with your mouse and vice versa. While some users may prefer the flexibility and precision of the command line, others may find the graphical interface more intuitive and user-friendly.
If you are more of a “command line” type and you prefer to launch commands rather than clicking around you can learn the syntax of the program through the command reference. This will allow you to perform different operations on the fly or organize the commands in a script that you can run yourself or share with others. It can be particularly helpful when you want to automate boring processes for your routine analysis.
If you are not familiar with the command lines and you prefer the graphical interface you can still accomplish all that you need by clicking on the proper options shown in the Object menu panel and then saving your work as a PyMOL session.
I personally find the command line to be more “reliable” but I also recognize the convenience and ease of use offered by the graphical interface, particularly for quick and simple adjustments. I will try to show you both options for most of the functions that will be discussed. Ultimately, it is up to you to decide which method works best for you based on your needs and preferences.
Load a Structure in PyMOL
The first thing you want to accomplish in PyMOL is to load a certain molecular structure and display it in the visualization area. To do that, you will need to have a protein structure file in a format that PyMOL can read. The program supports a variety of molecular file formats (pdb, mol, mol2, sdf, xyz,…).
You can obtain protein structure files from a pdb file the Protein Data Bank (PDB) website and other online database, or you can use structures that you generated from previous simulations (e.g., a gro file you obtained from a GROMACS simulation).
In PyMOL we have two ways of loading a structure:
-
Load it from a file that you have in your local machine using the
loadcommand. -
Fetch it from the Protein Data Bank using the
fetchcommand.
In the first case, you will simply type load followed by the name of the file (example.pdb) if the file is in the same directory otherwise specify the path to the file.
|
|
The second way allows you to directly retrieve the structure you need from the PDB database by typing fetch followed by the four-character PDB ID of the model you want to display.
|
|
If you are uncertain or don’t remember how to use a certain function you can always prompt help followed by the name of the command you need. The output will be a description of the functionalities and syntax of the selected command.
To get a general description of the load command:
|
|
You can also load and fetch the structures by using the Menu toolbar that appears when you drag your cursor upwards.
- Click on
File$\rightarrow$Open$\rightarrow$ Navigate to the location of your protein structure file and select it - Click on
File$\rightarrow$Get PDB$\rightarrow$ Insert the PDB code $\rightarrow$Download
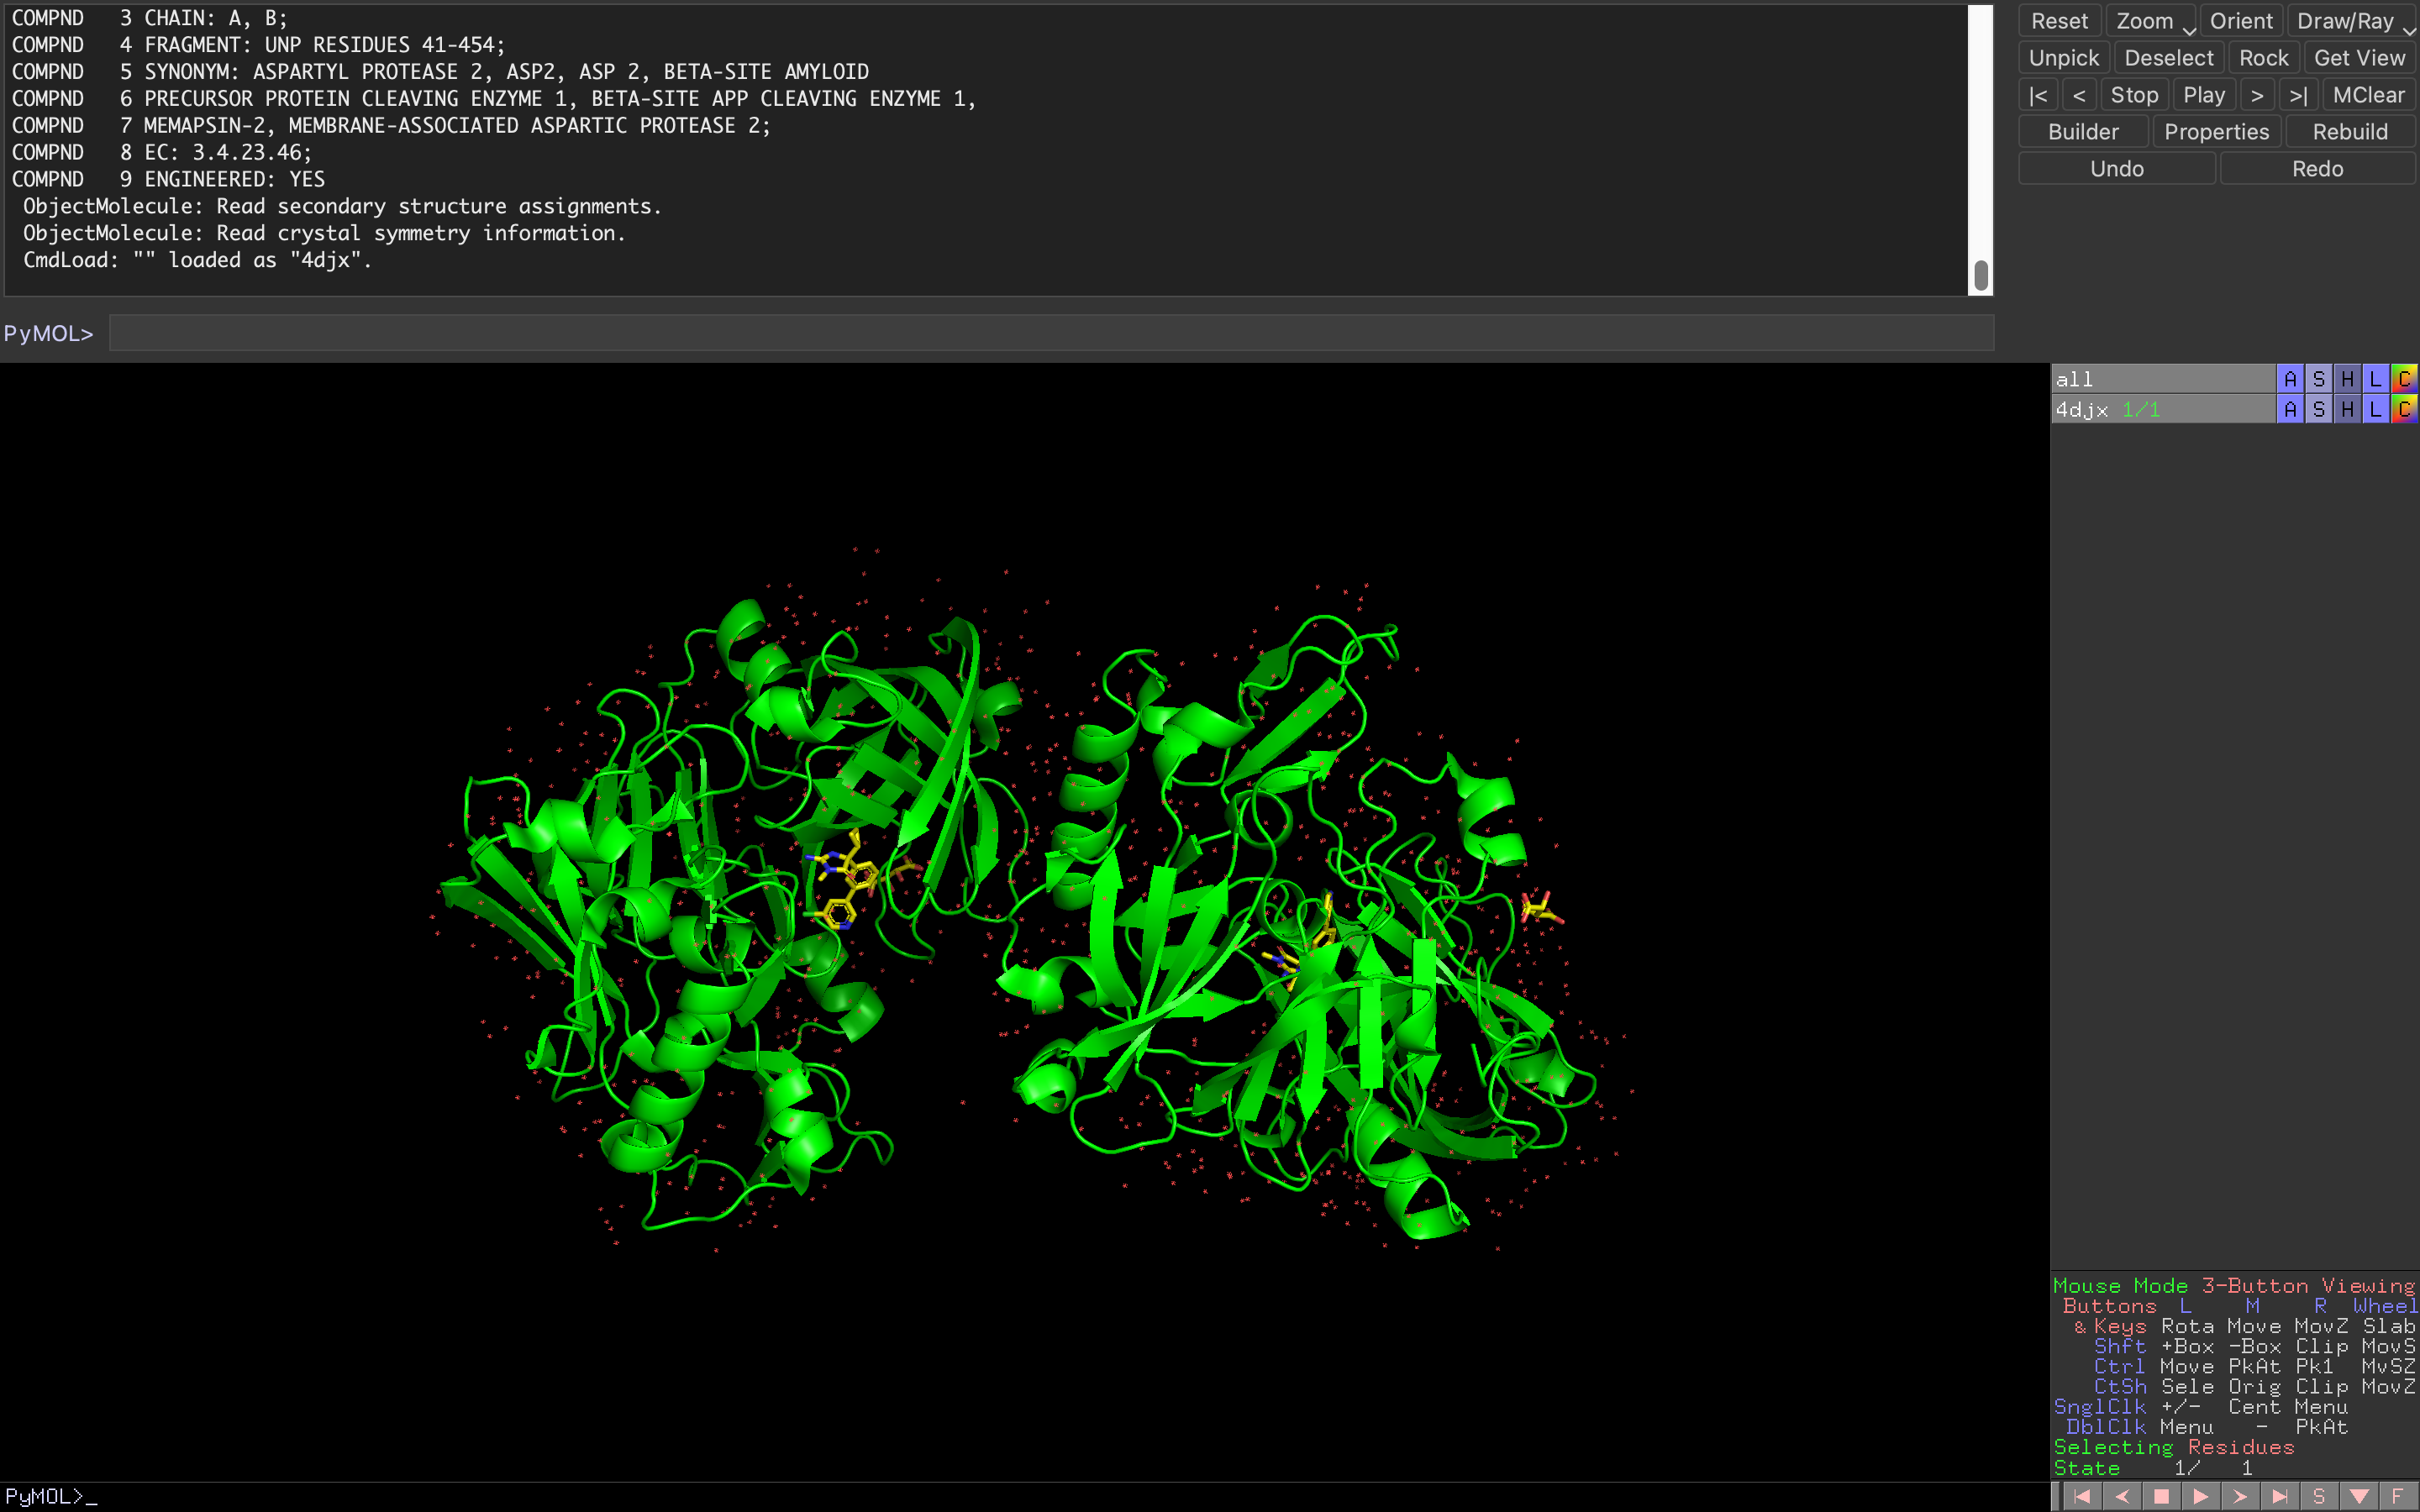
Once the file is loaded, you should see a graphical representation of the molecule on the screen. You can use the mouse to rotate, zoom, and move the molecule to get a better view.
Pymol Representations
We are all familiar with the simple “ball and springs” representations where molecules are considered as atoms (balls) held together by bonds (springs). Visualizing molecular systems in terms of balls and sticks is simple when we are dealing with smaller systems but the situation gets quickly out of hand as the system gets more complicated.
Throughout the course of the years, scientists have developed new molecular representation schemes that allow users to display molecular structures in different ways depending on their specific needs.
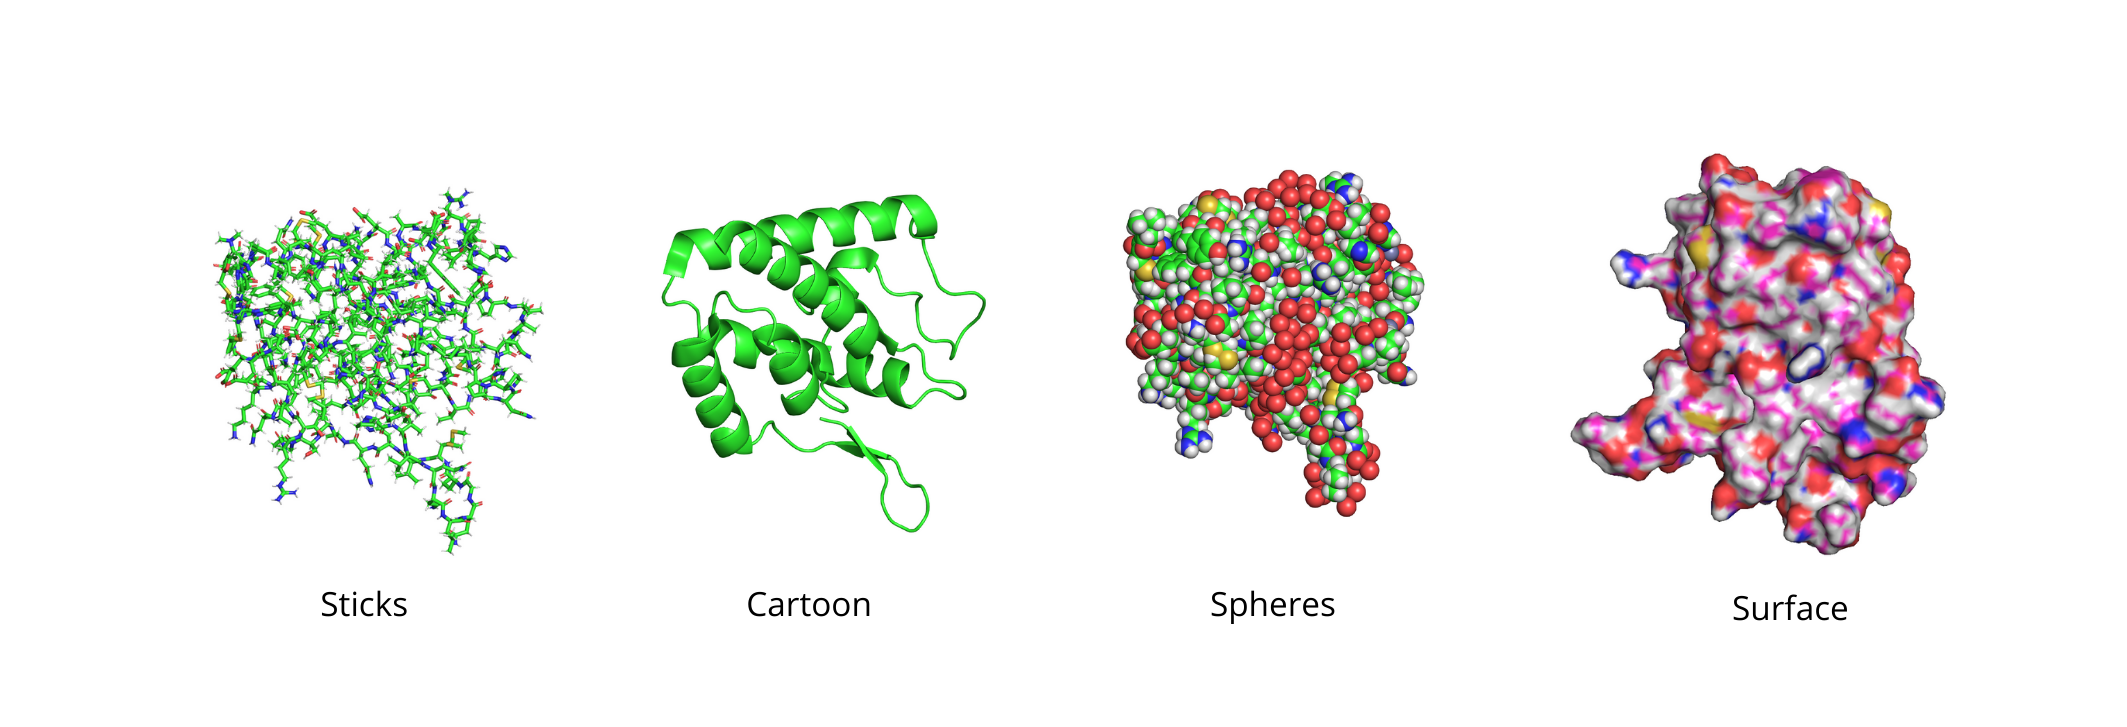
Some of the most common that you can find in PyMOL are the sticks, cartoon, spheres, and surface representations. Each one of them has pros and cons and you can access them both from the command line and the object menu panel.
There is no correct visualization state but depending on the case you may need to use one or the others, or a combination of multiple schemes. Some representations are meant to give you better details while others aim at simplifying the structure to get a general overview of the system.
For example, cartoons are good to get an overall representation of the system but does not allow you to get specific information about bonds or particular interaction arising in the system. Sticks are useful for displaying individual atoms and interactions but can get confusing to represent large systems. Spheres and surface give you a good representation of the outer shell of the protein but tend to “bury” the interior regions.
To display a molecule in a certain visualization state you can use the show command followed by the name of the representation. For example, if you want a sticks model of your entire system you can type:
|
|
The same goes for the others.
|
|
You can also decide to show only a part of the system by creating a selection.
|
|
Here I give you more detail on how to use the PyMOL selection tool .
Alternatively, you can use the object menu panel by clicking on S $\rightarrow$ as $\rightarrow$ cartoon/spheres…
Sometimes you may notice that parts of your system disappear when you move from a representation to the other. This is due to the fact that a certain part of your system can not be illustrated in the selected representation scheme.
For instance, you can not display a small organic molecule or an ion as cartoon so they disappear when you try to depict them with that representation.
Save an Image in PyMOL
PyMOL is an excellent tool that can be used as a viewer but as you may already know, it is also great for creating high-quality images to use in your publications.
After having loaded the structure and adjusted the display settings as desired you can use both the command line and the menu toolbar to save an image in the PNG format.
To save the image from the top menu toolbar click on File $\rightarrow$ Export image as $\rightarrow$ Choose the format. This will allow you to save the image in a variety of formats, including PNG, COLLADA, and POV-Ray.
If you want to achieve more control over the process you can do that from the command line by using the png command that captures a snapshot of the current display in the PNG format. The syntax is very intuitive, as is the case for most commands in PyMOL, you simply need to type the command followed by the file name (example.png).
|
|
This will save in the current directory. If you want to save in a specific folder (e.g., Downloads on macOS) you need to specify the path.
|
|
Note that the default use of the png function will provide a snapshot of your display in low quality. However, this command also has a few options that give you more control over the customization of the image size and resolution.
|
|
- Select the
pngcommand - Decide how you want to name the file (
filename.png) - Select an integer number (
X) corresponding to the width in pixels - Select an integer number (
X) corresponding to the height in pixels - Choose the resolution of your image in DPI (dots per inch). Publication quality figures generally require a dpi value of 300 or more.
- The
rayoption allows you to get a ray-traced version of the figure with superior details. By default, you will not get a ray-traced version of your figure, if you desire one you need to specify it withray=1.
Saving and Opening PyMOL Sessions
In certain scenarios, you may have customized a PyMOL session with specific selections and color schemes that you’d like to retain for future use, without having to start from scratch each time. While one approach is to write a script that runs upon terminal startup, there’s another option if scripting doesn’t suit you.
If you’ve manually adjusted the session to your liking, you can choose to save it. Here’s how:
- Navigate to
File→Save Session as. - Provide a name for the session, which will be saved as a
.psefile.
Later, when you reopen PyMOL, you can access your previously customized session:
- Go to
File→Open. - Select the
.psefile you saved earlier.
Save a PDB File in PyMOL
Sometimes you may want to save a pdb file from PyMOL.
For instance, you may have aligned the system and want to export the newly obtained coordinates. Another scenario is when you specifically want to export a defined selection of atoms, such as exporting a pdb file of a ligand in a protein-ligand system.
To save a PDB file, you can follow these simple steps:
- Navigate to
File→Export Molecule - Select the specific atoms or molecules you wish to export in the
Selectiontab. - Click on
Save. - Choose a name for the file and select from various available file formats for export (the default is the new PDBx/mCIF *.cif format).
Alternatively, you can take advantage of the save command. Here, you speciffy the filename and the selection you want to export.
|
|
For instance, to export only the alpha carbons:
|
|