RMSD Analysis in VMD: how to calculate and plot RMSD from a trajectory
VMD is a powerful software tool that offers much more than just molecular visualization. This blog post aims to provide you with a detailed, step-by-step procedure for executing one of the most common analyses, namely the Root-Mean-Square Deviation (RMSD) analysis, using VMD.
In case you missed it, we’ve already covered the basics of RMSD in previous articles. You can check the introductory article to RMSD here
So, in this post, we will not focus much on the theory but we will jump straight into the action, and concentrate on how to get things done in VMD.
RMSD Analysis in VMD
At the core of analyzing MD trajectories lies the RMSD which serves as a measure of structural similarity between different protein conformations within a trajectory.
It quantifies the extent of atomic deviations between a reference structure and subsequent frames, revealing how a protein’s conformation changes over the course of the simulation.
Imagine you’re exploring an MD trajectory in VMD, visualizing the movements of atoms in your system, and suddenly, you realize the need to assess the RMSD values for specific structural changes.
Perhaps, you will find it more convenient and familiar to handle such analyses directly within VMD. That’s why here I’ll walk you through the process of quickly obtaining RMSD insights using VMD.
The VMD RMSD Trajectory tool
To perform this analysis you can take advantage of the RMSD trajectory tool, a built-in function in VMD designed to compute the RMSD.
The RMSD analysis process is organized into several intuitive steps, which will be detailed below. Each step serves a distinct purpose, ensuring a systematic approach to your analysis.
Step 1: Loading the Trajectory
Before we begin the RMSD analysis, the first thing you need to do is to load your MD trajectory into VMD. If you’re unsure how to do this, you can refer to this previous article on loading trajectories in VMD.
Step 2: Accessing the RMSD Trajectory Tool
Once your trajectory is loaded, head to the “Extensions” menu in VMD. From there, navigate to the “Analysis” section, where you’ll find the much-awaited “RMSD Trajectory Tool.” Select it to open the interface dedicated to RMSD analysis.
This interface will open up.
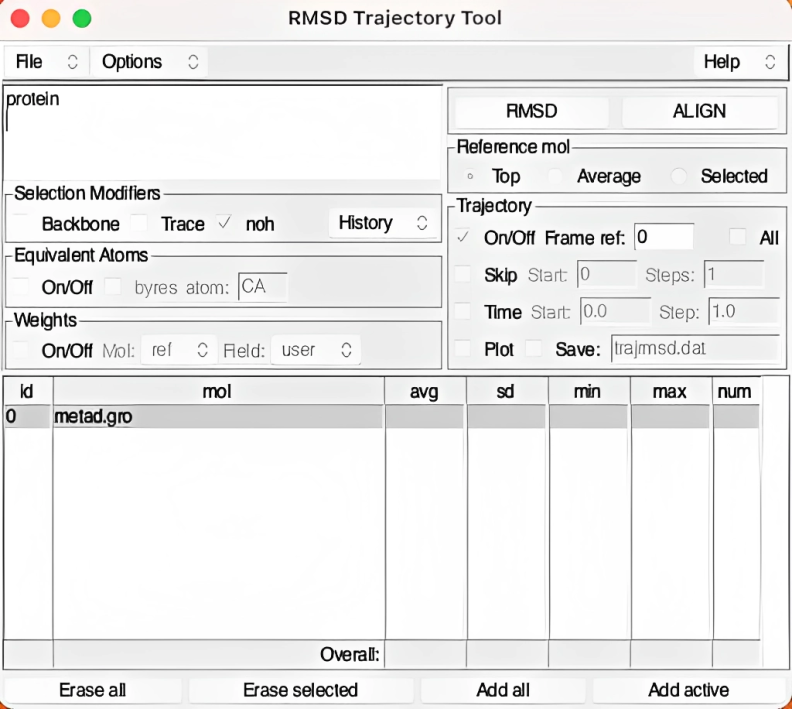
Step 3: Selecting the Region of Interest
Now, the first thing you need to do is to select the region you need to perform the RMSD calculation. In the RMSD trajectory tool interface, you’ll find an upper left panel that allows you to define the region for which you want to perform RMSD calculations.
To analyze the entire protein, simply enter protein in the selection box. If you wish to focus exclusively on the backbone (a common scenario), you can tick the “backbone” box in the selection modifiers.
Furthermore, the flexibility of the tool enables you to measure the RMSD for any specific region of interest. For instance, suppose you only want to include residues from 1 to 100 in your analysis. In that case, you can simply achieve this by typing resid 1 to 100 in the selection box.
This allows you to have complete control over the region selection, enabling you to target specific segments of your molecular system for analysis.
Step 4: Choosing the Reference Frame
In the RMSD trajectory tool interface, you can select the reference frame for performing RMSD computations.
By default, VMD sets the first frame (frame number 0) as the reference, but you can easily modify this setting to suit your analysis needs.
To change the reference frame, simply enter the desired frame number in the Frame ref: box. For instance, if you wish to use the third frame (frame number 2) as the reference, update the number accordingly. In the provided example, the reference frame is the first frame, indicated as 0.
Step 5: RMSD Calculation
With all the necessary settings in place, it’s time to initiate the RMSD calculations. Simply click on the RMSD button located in the upper right panel of the interface. The tool will perform the analysis, computing the RMSD values for the selected region over the trajectory.
After the calculations are complete, the results will be presented in the table below. Here, you will find essential metrics, including the average RMSD value, standard deviation, and other statistical measures.
While the table provides precise data, you might find a graphical representation more intuitive for visualizing the trends and patterns. For a clearer sense of your molecular system’s conformational changes over time, consider generating a plot of the RMSD values.
Step 6: Visualizing the Results
Once you have performed the RMSD analysis using the VMD RMSD Trajectory Tool, you can choose to visualize the results for a clearer understanding.
To do so, simply tick the Plot box within the RMSD trajectory tool interface and then press the RMSD button.
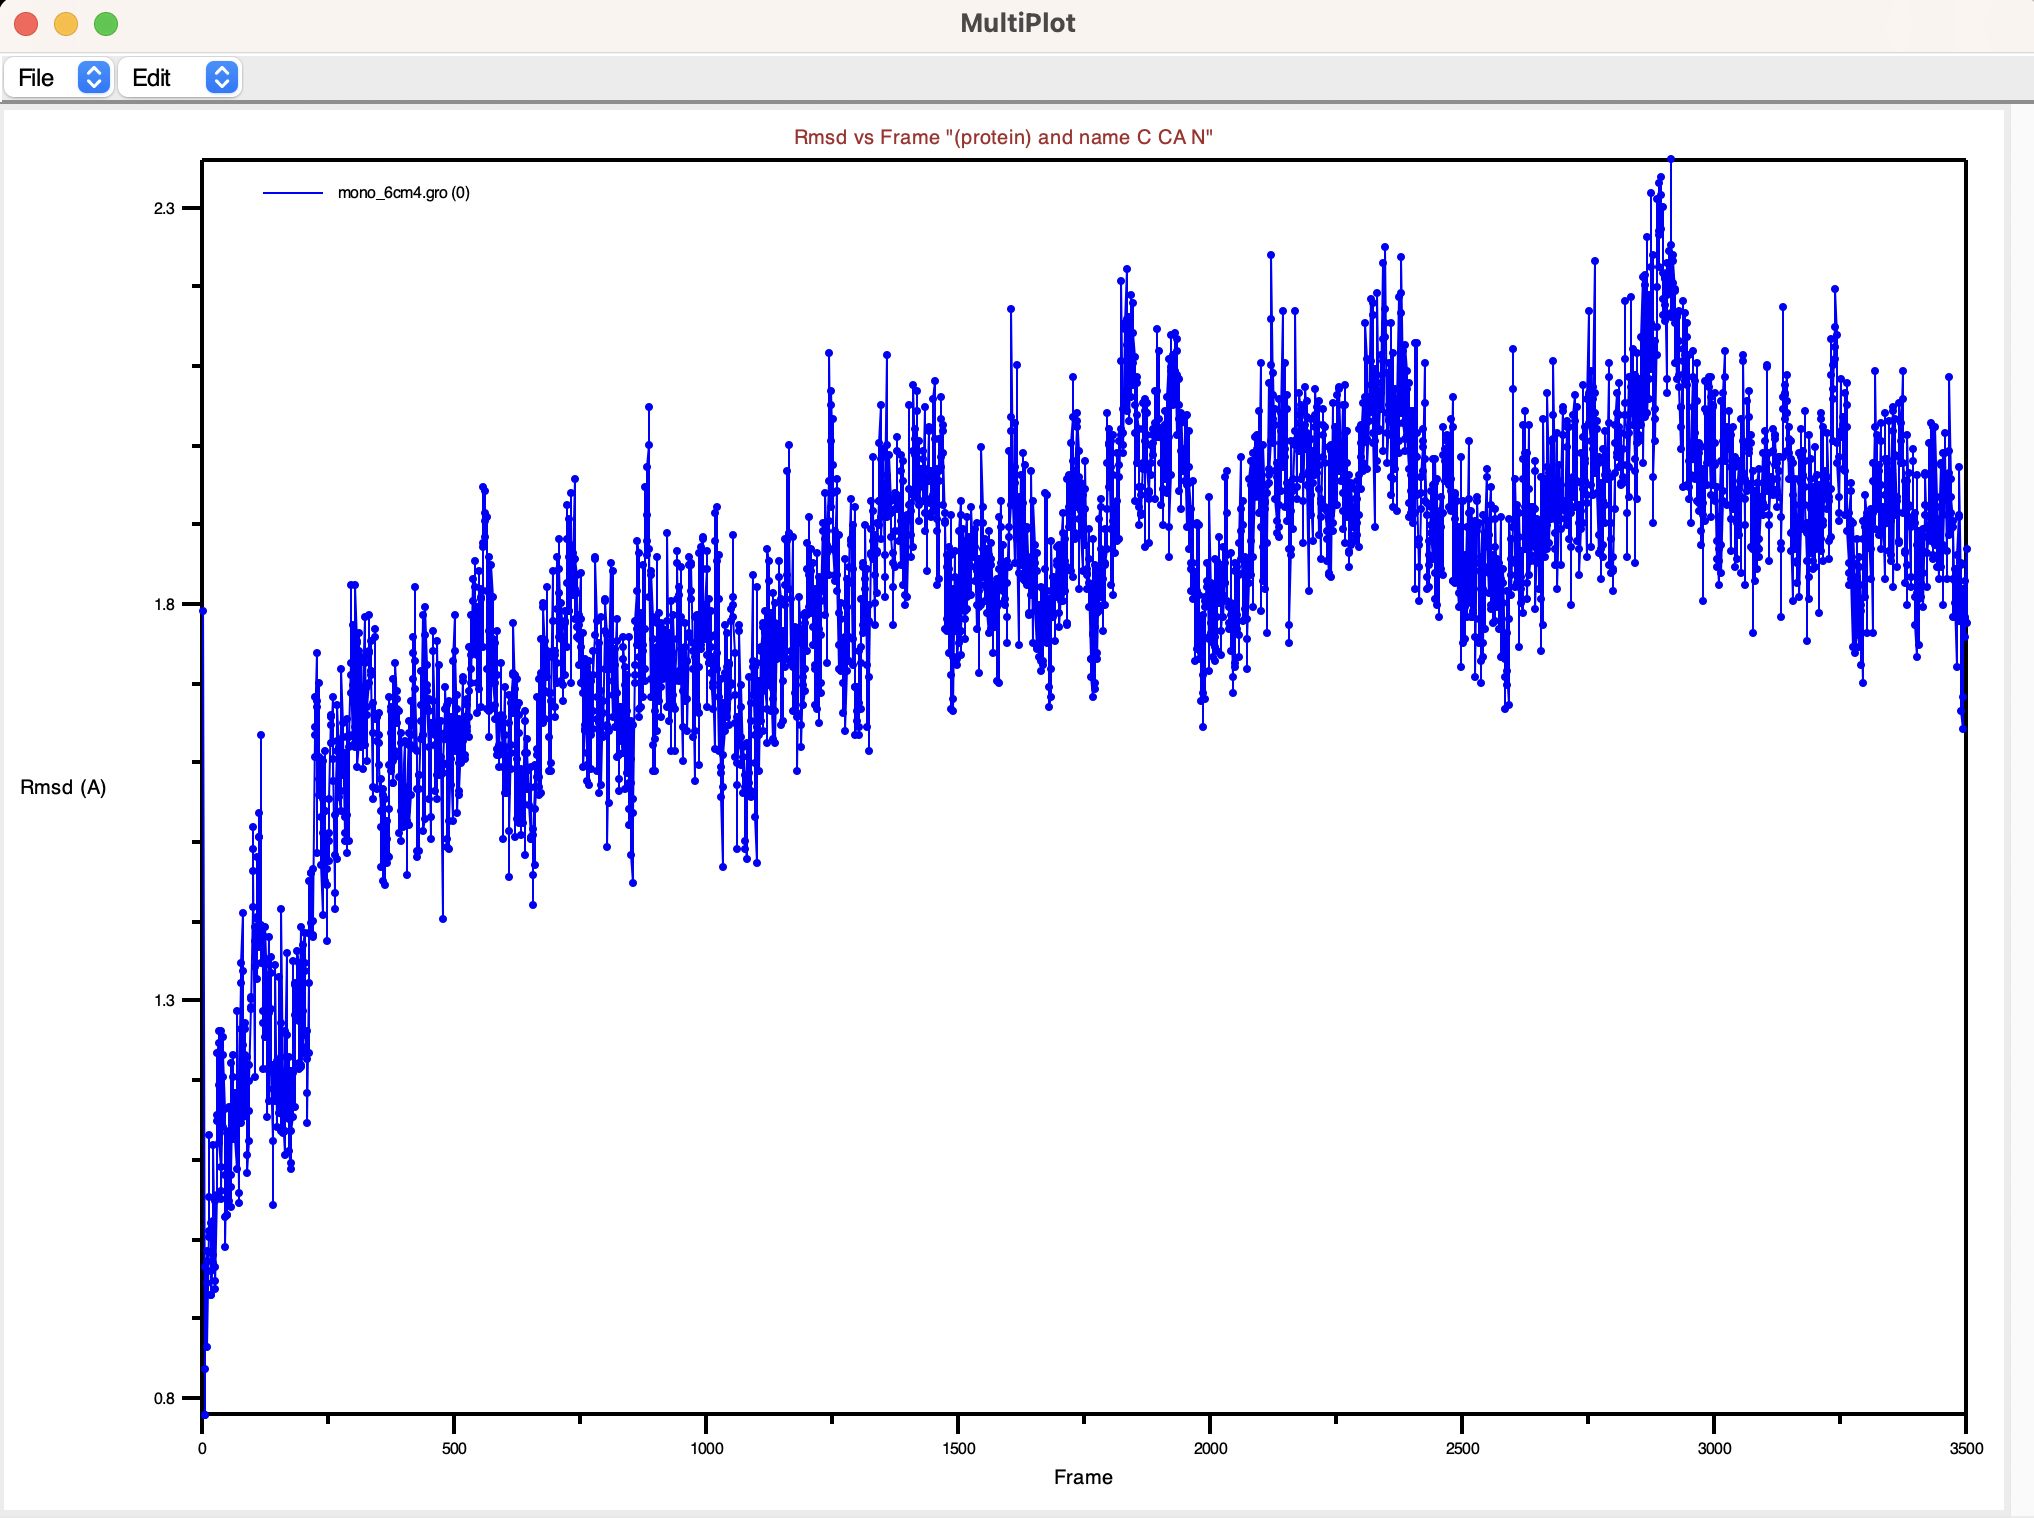
This action generates a plot showcasing the computed RMSD values over time and will provide valuable insights into the changes and fluctuations in your molecular system’s conformation during the simulation.
The resulting plot will be similar to the one shown here, enabling you to interact with it and make necessary edits. To customize the plot further, you can navigate to Edit and then select Edit Plot.
If you desire a more aesthetically pleasing plot or prefer to use external tools for visualization, you can save the data in a file and then import the data into your preferred plotting software.
To do this, Simply click on the Save box within the interface and, optionally, change the name of the file (trajrmsd.dat by default). Then, click on the RMSD button to perform the calculations and store the data in a file in the dat format that you can open with any text editor.
It will look something like this: with the frame on the first column and the value of RMSD in Å in the second column
|
|
|
|