Hydrogen bond Analysis with VMD
VMD, a powerful software tool, offers much more than just molecular visualization. In this blog post, you will be guided through a step-by-step procedure for conducting one of the most common analyses in molecular dynamics, namely Hydrogen Bond Analysis, using VMD.
If you’re new to the concept of hydrogen bonds, don’t worry; we’ve covered the basics in a previous article. Check the introductory article on hydrogen bonds here.
Now, let’s dive straight into the action and explore how to effectively perform hydrogen bond analysis in VMD.
Hydrogen Bond Analysis in VMD
Hydrogen bond analysis is a fundamental aspect of studying molecular interactions, particularly in biomolecular systems. It helps us understand the strength and nature of hydrogen bonding within a molecular structure.
Imagine you’re visualizing a protein-ligand complex or a biomolecular system undergoing a molecular dynamics simulation in VMD. You observe intriguing interactions and wish to explore the hydrogen bonding patterns within the system.
By learning how to conduct hydrogen bond analysis directly within VMD, you can efficiently unravel the intricate hydrogen bond networks and gain valuable insights into the behavior of your molecular system.
Let’s get started!
The Hbonds plugin in VMD
To conduct hydrogen bond analysis in VMD, we’ll utilize the Hbonds plugin, specifically designed for this purpose.
The hydrogen bond analysis process is structured into several straightforward and intuitive steps, which we will elaborate on below. Each step has a specific role, ensuring a systematic and well-organized approach to your analysis.
Step 1: Loading the Trajectory
Before we begin the RMSD analysis, the first thing you need to do is to load your MD trajectory into VMD. If you’re unsure how to do this, you can refer to this previous article on loading trajectories in VMD.
Step 2: Navigating to the Hydrogen Bonds Tool
After successfully loading your trajectory in VMD, locate the “Extensions” menu. Within the “Extensions” menu, find and click on “Analysis” to access various analysis tools.
Once you’re in the “Analysis” section, you’ll find the “Hydrogen Bonds” tool waiting for you.
Click on it, and the interface dedicated to hydrogen bond analysis will open up.
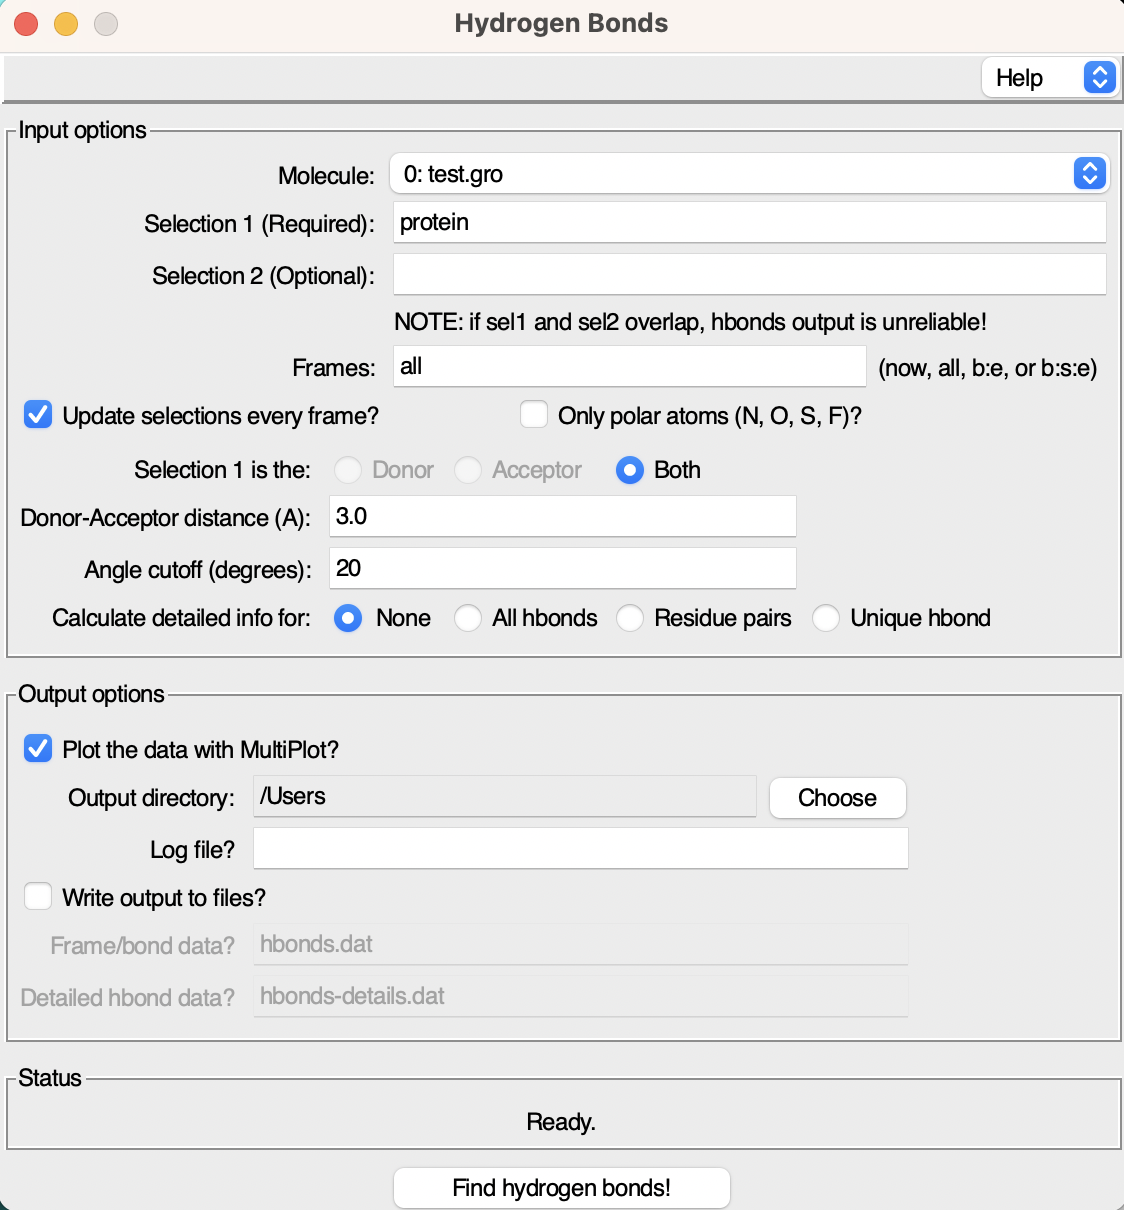
As you can see the interface consists of two windows:
- Input Options: Here, you can specify various parameters for the hydrogen bond analysis.
- Output Options: This section allows you to set preferences for the analysis outputs, such as the file name and saving directory.
Step 3: Select the Groups for Analysis
In this crucial third step, we need to specify the two groups that we want to analyze for hydrogen bonds. To do this, simply navigate to the selection box and add the relevant group names.
For instance, if you’re interested in examining the hydrogen bonds between a small molecule (ligand) and a protein, enter protein in the first selection box and the name of the ligand (e.g., resname LIG) in the second box.
If you’re looking to focus on a specific interaction, you can achieve this by providing more precise selections. For example, if you want to analyze hydrogen bonds between the ligand and a particular residue (e.g., residue number 100), simply enter resid 100 in the first selection box.
Step 4: Setting the Cutoffs for Hydrogen Bonds
In the fourth step, we’ll define the cutoff values that determine hydrogen bond contacts.
For an interaction to be considered a hydrogen bond, both the distance and the angle between the atoms involved must fall within these cutoff values. The choice of cutoff values can be somewhat arbitrary, allowing you to adjust the flexibility of the hydrogen bond analysis to suit your specific needs.
Now, of course, you will never encounter a hydrogen bond with a distance of 10 Å, but you can set an acceptable distance cutoff within a range of 3 to 4 Å. As a standard, I often use a distance cutoff of 3.5 Å and an angle cutoff of 30°, but you can also adopt the default values proposed by VMD.
Feel free to fine-tune these cutoff values based on your research requirements and the characteristics of your molecular system and then move to the next step.
Step 5: Generating Plots and Output file
In this step, we will configure the Output options for our hydrogen bond analysis.
- Decide whether you want VMD to generate plots automatically for you by checking the Plot the data with MultiPlot box.
- Select the directory where you want to store the analysis files.
- Specify the name of the log file that will contain the parameters used in the calculation.
- Choose a meaningful name for the critical file,
hbond.dat, which will store the actual data for you to plot and analyze as you wish. - Additionally, select a name for the file that will contain all the details about each hydrogen bond identified during the analysis
hbonds-details.dat.
Once you’ve configured these output options, simply click on Find hydrogen bonds to initiate the analysis.
Step 6: Analyzing the Results
Now, let’s interpret the results of our hydrogen bond analysis using a specific example, where we’ll focus on the number of hydrogen bonds formed between a ligand and the protein.
If you opted to Plot the data with MultiPlot during the configuration, VMD will automatically generate a plot for you.
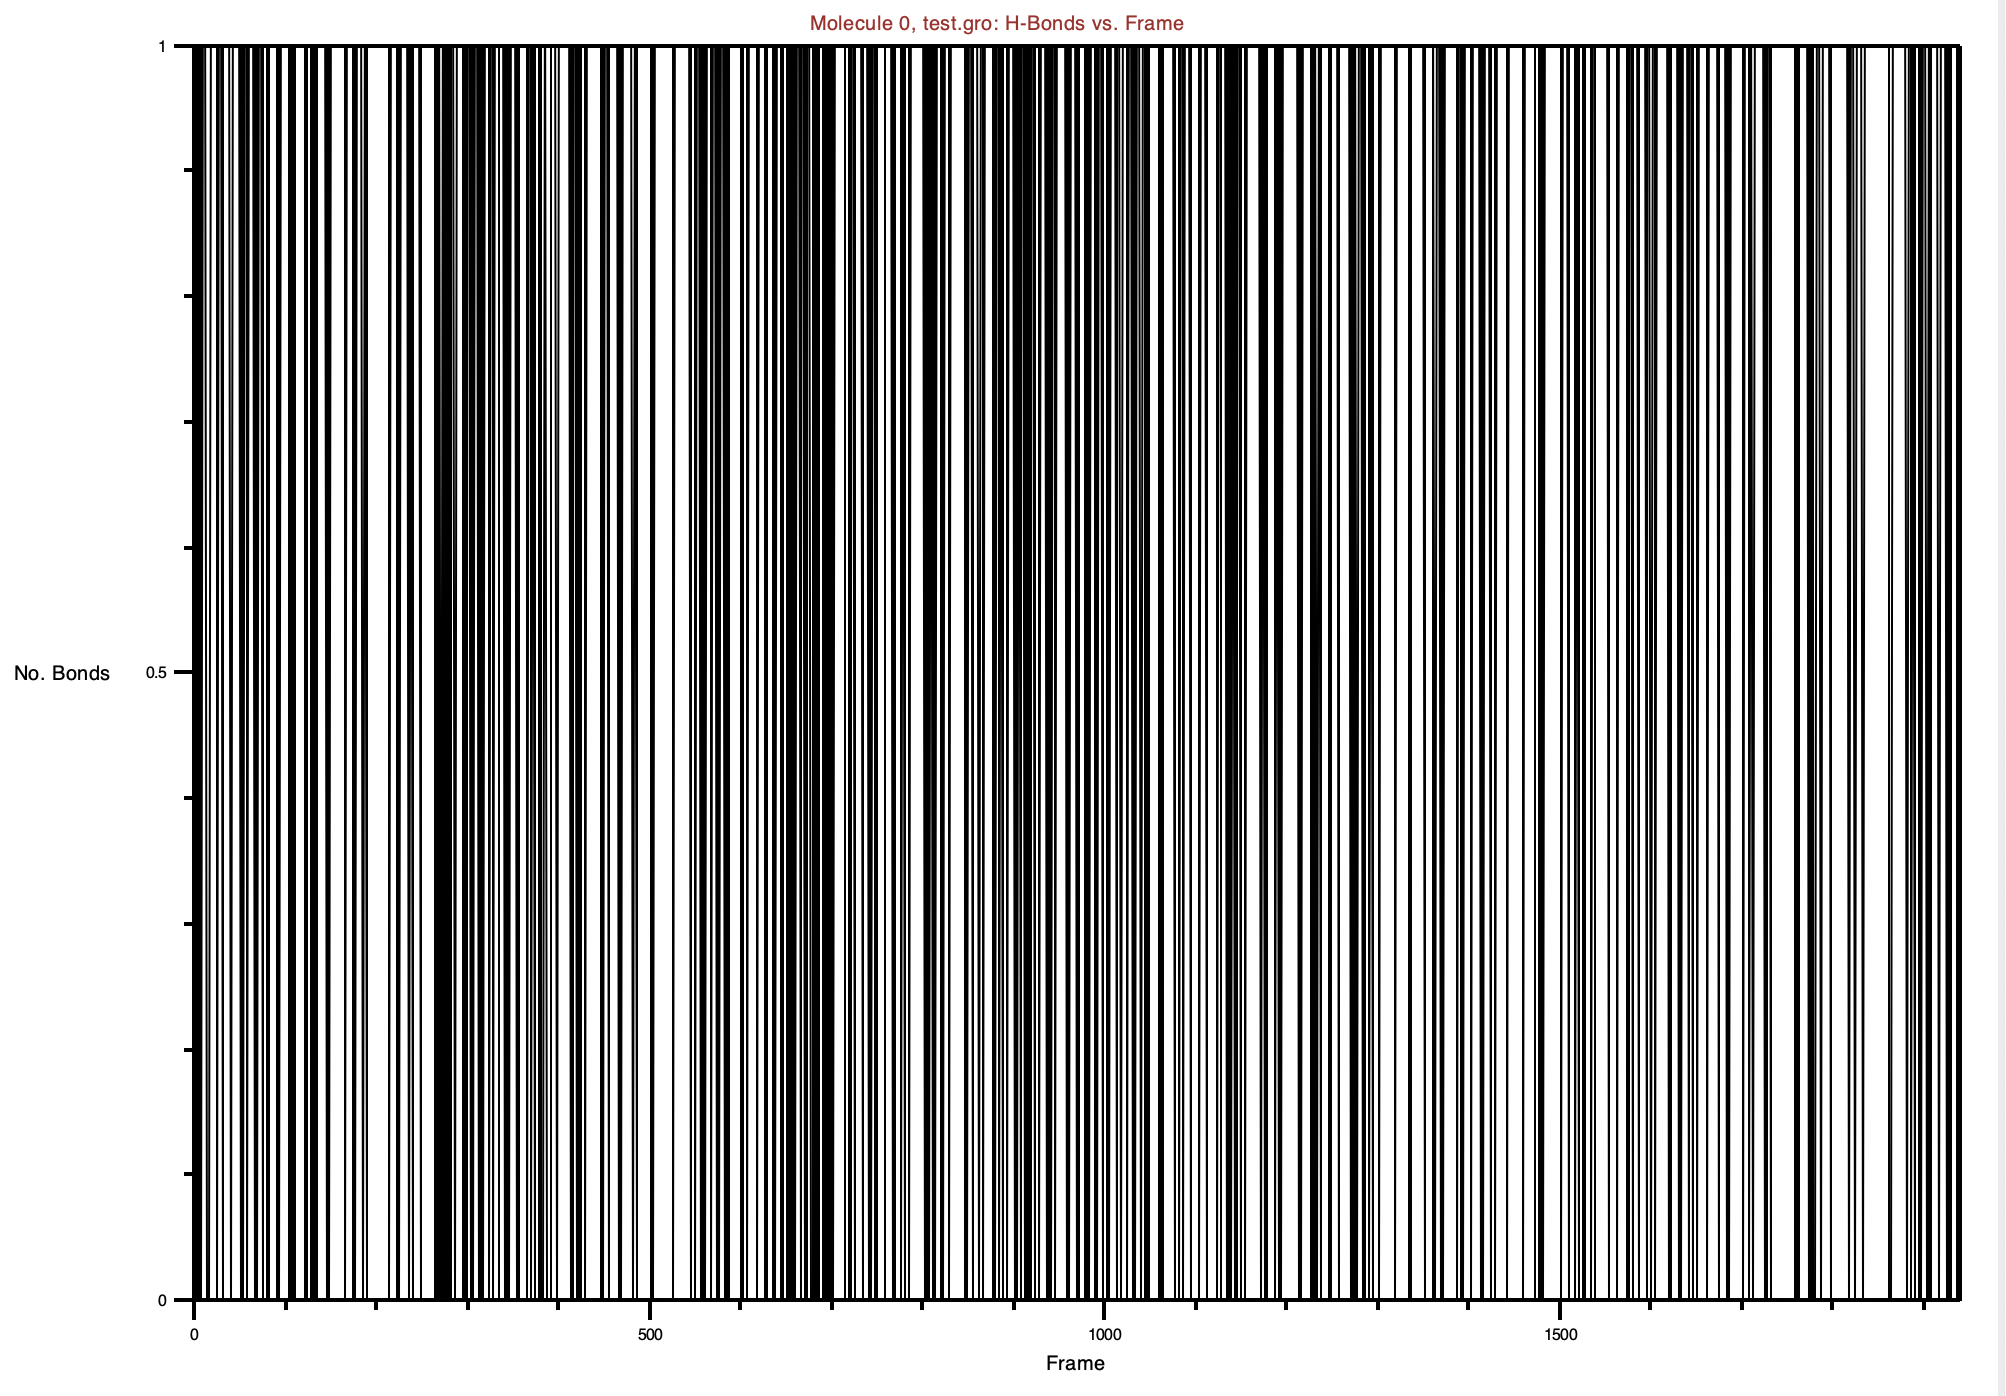
The plot illustrates how the number of hydrogen bonds changes over the trajectory frames. In this example, we observe that the hydrogen bonds between the ligand and the protein fluctuate between 0 and 1.
If you prefer to generate the plot yourself, you can navigate to the specified output directory, where you’ll find the hbond.dat file.
The hbond.dat file will have two columns: the first column represents the frame number, and the second column indicates the number of hydrogen bonds between the selected groups. The data will look something like this:
|
|
As always, you have the flexibility to plot this data using your preferred plotting tool (e.g., Python).
|
|
Step 6: Detailed Hydrogen Bond Information
Another valuable file generated from this analysis is the hbonds-details.dat file, containing specific details about the identified hydrogen bonds. This file provides insightful information, such as the number of unique hydrogen bonds found, the donor and acceptor atom pairs involved, and the occupancy of each bond (i.e., how frequently the bond occurs throughout the trajectory).
Here’s an example of the content you might find in the hbonds-details.dat file:
|
|
In this example, the analysis identified one hydrogen bond. The specific donor atom is labeled as LIG303-Side, and the acceptor atom is ASP227-Side. The occupancy of this hydrogen bond, representing the percentage of frames in which it occurs, is recorded as 80.58%.
By examining the hbonds-details.dat file, you can gain deeper insights into the individual hydrogen bonding interactions within your molecular system.
Additionally, remember that all the parameters used for this specific hydrogen bond analysis are recorded in the log file. This provides a valuable reference in case you decide to experiment with different parameters in future analyses.
Below is an example of a log file generated by VMD, containing the parameters used for this particular run:
|
|
Through this analysis, you’ve successfully explored the hydrogen bonding behavior in your system, gaining both an overview of the hydrogen bond occurrences and a detailed breakdown of the specific interactions. Now, you are well-equipped to utilize this information for further analysis and to advance your research in computational chemistry.