How to load GROMACS trajectories in VMD
Ok, so you have run your molecular simulation with GROMACS, and now you would like to have a visual representation to gain a deeper understanding of the dynamical behavior of your system.
In this blog post, I will explain how you can achieve it using Visual Molecular Dynamics (VMD), which despite its outdated interface is still the go-to tool to visualize molecular trajectories.
The main focus of this article is to show you how to load your xtc trajectories in VMD and then how to navigate and observe them so that later on you can extract relevant information hidden in your simulations.
Let’s dive in!
Loading GROMACS trajectories in VMD: Step-by-Step Guide
As you may imagine, the first step will be to load your trajectory in VMD. This is pretty straightforward once you know how to do it.
To start off, make sure you have VMD installed and up and running on your system. Once you are all set, you only need to locate two files on your computer:
-
A reference structure containing the initial coordinates for your system. You can use both the gro file and the pdb file format.
-
A GROMACS trajectory file which contains the atomic coordinates and velocities recorded throughout your simulation. It is good practice to use the compressed trajectory format, namely the xtc file as it is less memory-consuming and therefore easier to load and move from one workstation to another.
That’s all you need.
In VMD, you have two main options for loading your GROMACS trajectory.
The first one relies on the command line. You can simply go to the directory where the files are stored and load them with this command:
|
|
This is generally the fastest and more reliable way to load a trajectory.
However, if you prefer a more visual and user-friendly method, you can opt for loading trajectories through the graphical user interface (GUI) of the software.
This approach involves a two-step process. Firstly, you load the structure file, and then you can load the trajectory itself, integrating it with the reference structure.
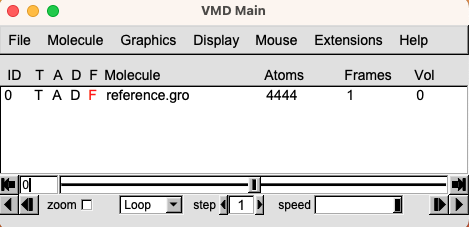
- Open VMD. Go to File $\rightarrow$ New Molecule. This will open the Molecule File Browser menu. Click on Browse and look for the gro or pdb file, select it, and click Load. The loaded molecule will display on the VMD Main menu.
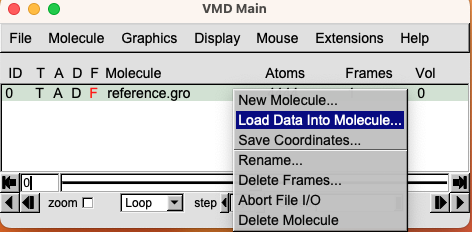
- Now click on the loaded file to select it and then right-click on it. Select Load Data Into Molecule. Once again, click on Browse, look for the trajectory file, and Load it. You will see that the initial structure will start moving as the trajectory slowly loads.
Sometimes you may encounter an error or you may notice that the trajectory is not loaded. This is probably due to the fact that the two files provided have a non-matching number of atoms.
Always remember that the number of atoms in the gro and xtc files needs to be the same otherwise you won’t be able to correctly load the trajectory.
For instance, if your gro file only contains the protein, then you will need to load the xtc file that only contains the velocities and coordinates of the protein. If you try to load the entire xtc file containing also other atoms (e.g., water) then you will not be able to do so.
Visualizing and Navigating Trajectories in VMD
Once the trajectory is loaded into VMD, you can navigate through it using the VMD player, which is a powerful tool within the software.
The VMD player facilitates the visualization and exploration of molecular dynamics trajectories in a dynamic and interactive manner.
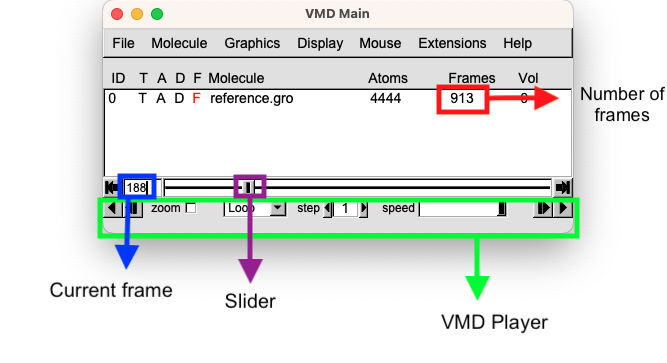
When working with the VMD player, there are four key panels to keep in mind:
-
Total Number of Frames: This panel displays the overall number of frames present in the loaded trajectory.
-
Slider: The slider is a fundamental control that enables navigation from one frame to another by simply dragging it.
-
Current Frame Selection: This panel tells you the frame you are currently looking at. You can also use it as a convenient text entry, to specify a certain frame you are interested in. This functionality facilitates focused analysis and examination of particular frames of significance.
-
Player Controls: The VMD player includes intuitive controls for playing the trajectory as a movie. You can use the buttons in this panel to reproduce the trajectory, adjust the speed to your preference, and even modify the number of steps you want to show in the GUI.
Creating representations for enhanced visualization
One of the key features of VMD is its ability to create diverse and customizable representations of molecular structures, leading to enhanced visualization and comprehension of the trajectory data.
By leveraging the representation tools in VMD, you can create visual depictions that bring clarity and coherence to your molecular simulations.
You can select the representation that is more suitable for your specific case by going to Graphics $\rightarrow$ Representations.
This will open up the Graphical Representations menu that you can use to customize the aspect of your system.
When observing molecular simulations, it is not uncommon to encounter a lack of smoothness in the visual representation. Luckily, VMD offers a handy solution to enhance the visualization of your trajectory using the VMD trajectory smoothing feature.
From the Graphical Representations menu you can click on Trajectory. Then you can increase the Trajectory Smoothing Window Size to have a smoother video.
Analyze Trajectories with VMD
Once you have successfully loaded and visualized your GROMACS trajectories in VMD, the next crucial step is to analyze the data to extract meaningful insights from your molecular simulations. VMD provides a range of powerful analysis tools that can help you delve deeper into the behavior of your system.
Here, I will link you to introduce a few interesting analyses you can perform using VMD:
- Highlight Key Interactions and Track Changes: Visualize crucial interactions and monitor how distances, angles, or dihedrals change throughout the simulation. Gain valuable insights into your system’s dynamics and stability.
- H Bond Analysis: Identify hydrogen bonds throughout the trajectory.
- RMSD Analysis: Assess structural deviations relative to a reference structure using Root Mean Square Deviation (RMSD) analysis.
- Create Movies: Generate movies from your simulations.
These are just a few examples of the analysis you can perform with VMD. The software offers a wealth of other analysis options, and depending on the specific questions you want to address, you can explore additional tools and techniques to gain a comprehensive understanding of your molecular dynamics simulation.