VMD Representations and Color Schemes
One of the key features of molecular visualization software lies in its capacity to tailor the visual representation of molecular systems.
Having previously explored this aspect with PyMOL in a dedicated article, we now shift our focus to elucidate the process within VMD. We have been there, you open VMD, and you would like to customize the appearance of your system. Maybe you want to extract an image and/or a video or you simply want to visualize something in greater detail.
Well, if you are feeling lost navigating the sea of buttons and options in VMD, then don’t worry, you are in the right place.
Here, we will discuss how you can customize the representation, coloring schemes, and material of your system. You will learn what are the default capabilities on VMD and later on, I will also give you more insights on how you can create your own customizations. Furthermore, we will discuss how to modify the appearance of specified selections of atoms.
Let’s start.
Customize your VMD Display: The Graphical Representation Menu
To commence our journey, let’s elucidate the process of accessing the menu for modifying representations and colors.
This is a straightforward task – navigate to:
Executing this elementary step reveals the Graphical Representations menu, as illustrated below.
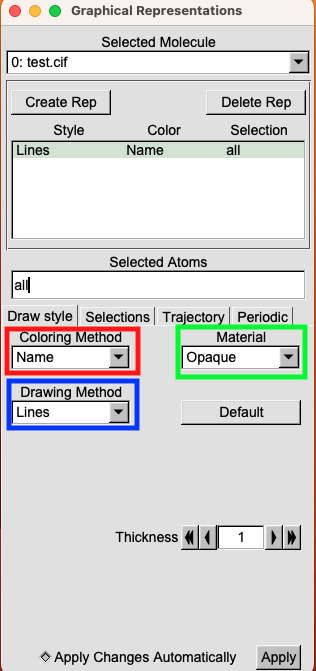
You can see that VMD gives you a lot of different options. Here, I decided to only focus on the main three possibilities.
- Coloring Method (Red): Determines the color of the selected object.
- Drawing Method (Blue): Dictates the representation style.
- Material (Green): Specifies the material used for visualizing the selection.
Change Representation in VMD
Let’s start by discussing how to change the representation of your system in VMD.
To initiate this, simply navigate to the Drawing Method menu. This will open a panel with different options from which you can select. The majority of drawing methods should be familiar to you. Some of them were already discussed in previous articles while some others are pretty intuitive to understand.
For instance, lines render bonds as lines, points manifest as points, and then there’s the intriguing NewCartoon option, revealing the secondary structure of proteins.
Here is a summary table reporting some of the most common representations and their respective descriptions.
| Representation | Description |
|---|---|
| Lines | Simple lines for bonds, points for atoms |
| Bonds | Lighted cylinders for bonds |
| CPK | Scaled VDW spheres, with cylinders for bonds |
| Points | Just points for atoms, no bonds |
| VDW | Solid van der Waals spheres for atoms, no bonds |
| Dotted | Dotted van der Waals spheres for atoms, no bonds |
| Solvent | Dotted representation of the solvent accessible surface |
| Trace | Connected cylindrical segments through Cₐ atoms |
| Licorice | Spheres for atoms, cylinders for bonds, same radius |
| Ribbons | Flat ribbon through the Cₐ atoms |
| Tube | Smooth cylindrical tube through the Cₐ atoms |
| Cartoon | Cartoon diagram (cylinders and ribbons) based on secondary structure |
| NewCartoon | Secondary Structure |
| MSMS | Molecular surface as determined by the program MSMS |
| HBonds | Display hydrogen bonds |
| Surf | Molecular surface as determined by SURF |
| Off | Do not draw anything |
Tailoring Representations in VMD
It’s worth noting that each representation in VMD offers various customization options based on the selected drawing method.
For example, if you opt for the VDW Representation, where atoms are depicted as Van der Waals spheres, you’ll discover a panel in the bottom right corner allowing you to tweak the sphere scale and resolution.
Let’s compare the two scenarios: one with a sphere scale of 1.0 and a resolution of 12, and another with a sphere scale of 2.0 and a resolution of 32.
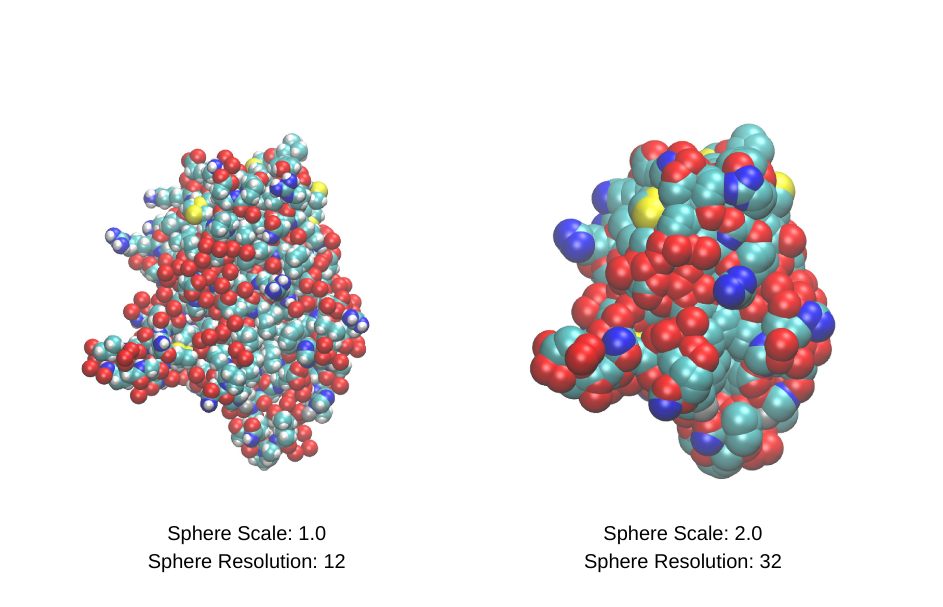
As evident from the comparison, the adjustments in sphere scale and resolution yield discernible differences. This principle holds true for various other representations within VMD. The flexibility in customization empowers users to tailor visualizations to their specific preferences and analytical needs.
Change Color in VMD
Let’s now discuss how to change colors in VMD.
Initiate the color customization process by clicking on the Coloring Method. This action opens a dedicated panel, presenting a variety of intuitive options catering to different color preferences.
Here are some of the available options.
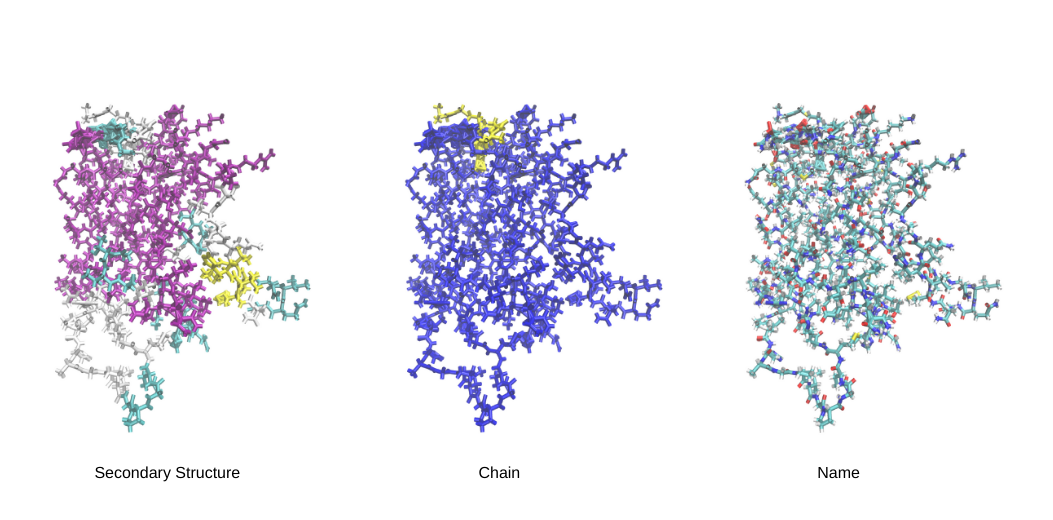
Key Color Categories
-
Secondary Structure: Color your molecular entities based on their secondary structure, providing a visual cue for helices, sheets, and loops.
-
Residue Name: Customize colors according to the specific names of residues, enhancing the distinction between different molecular components.
-
Residue Type: Opt for color-coding based on the type of residues, providing insights into the molecular composition.
-
Chain: Implement color distinctions for different chains within your molecular system, aiding in the visualization of complex structures.
-
Name: Color based on the name of atoms.
Personalized Color Selection
For a more tailored approach, choose the ColorID option. This opens a convenient window on the right, allowing you to handpick among 32 colors, the exact one that suits your visualization goals. This flexibility ensures that your molecular representations align with your aesthetic preferences and requirements.
Change Materials in VMD
The change of material is the final way to adjust your molecular representation.
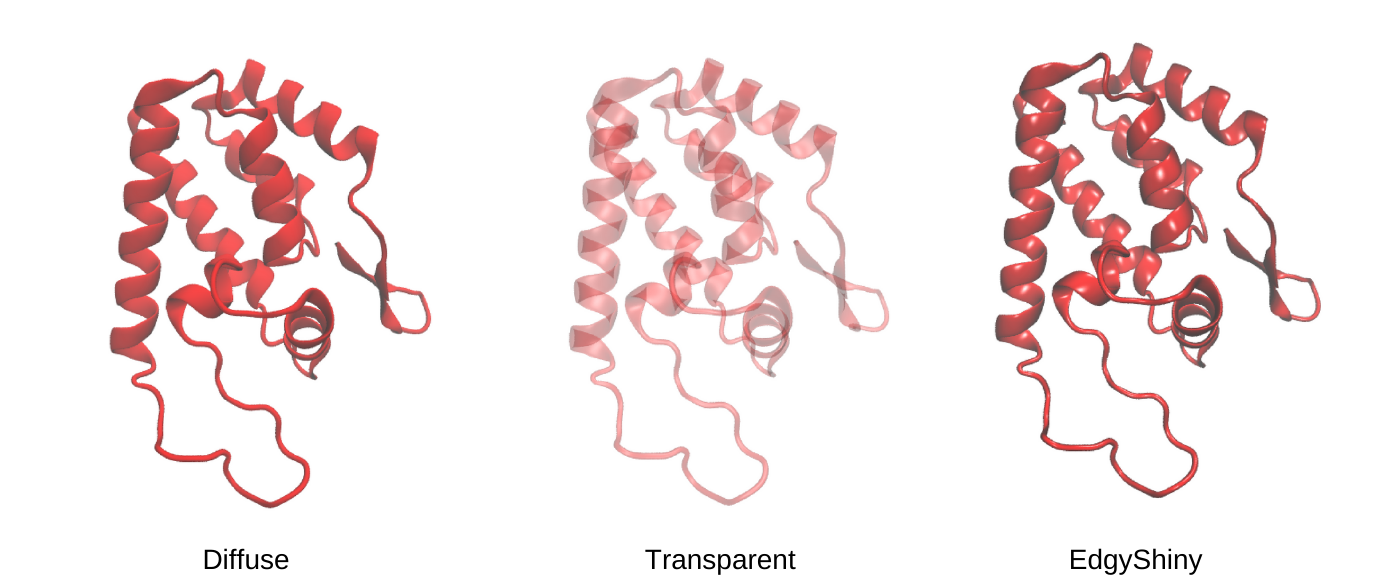
To do this you can click on the Material section. A window will open showing you different options to modify the material. The structure will appear different depending on the material. For instance, you can choose different materials to make the image more transparent or shiny, and so on.
Create your custom material
For those seeking a more personalized touch, VMD provides the option to create your own materials. Navigate to the Materials menu via:
Within this space, one can experiment with settings to create a new material.
Modify Specific Atom Groups in VMD
More often than not, you will find yourself wanting to modify just a specific selection of atoms in your system.
For instance, you might want to highlight a specific residue, and you want to change its representation or color. Or maybe you want to modify the appearance of a ligand in your protein-ligand system.
To accomplish this, you first need to create a selection containing the atoms you want to modify.
Once this subset is established, one can use all the customization options shown above.
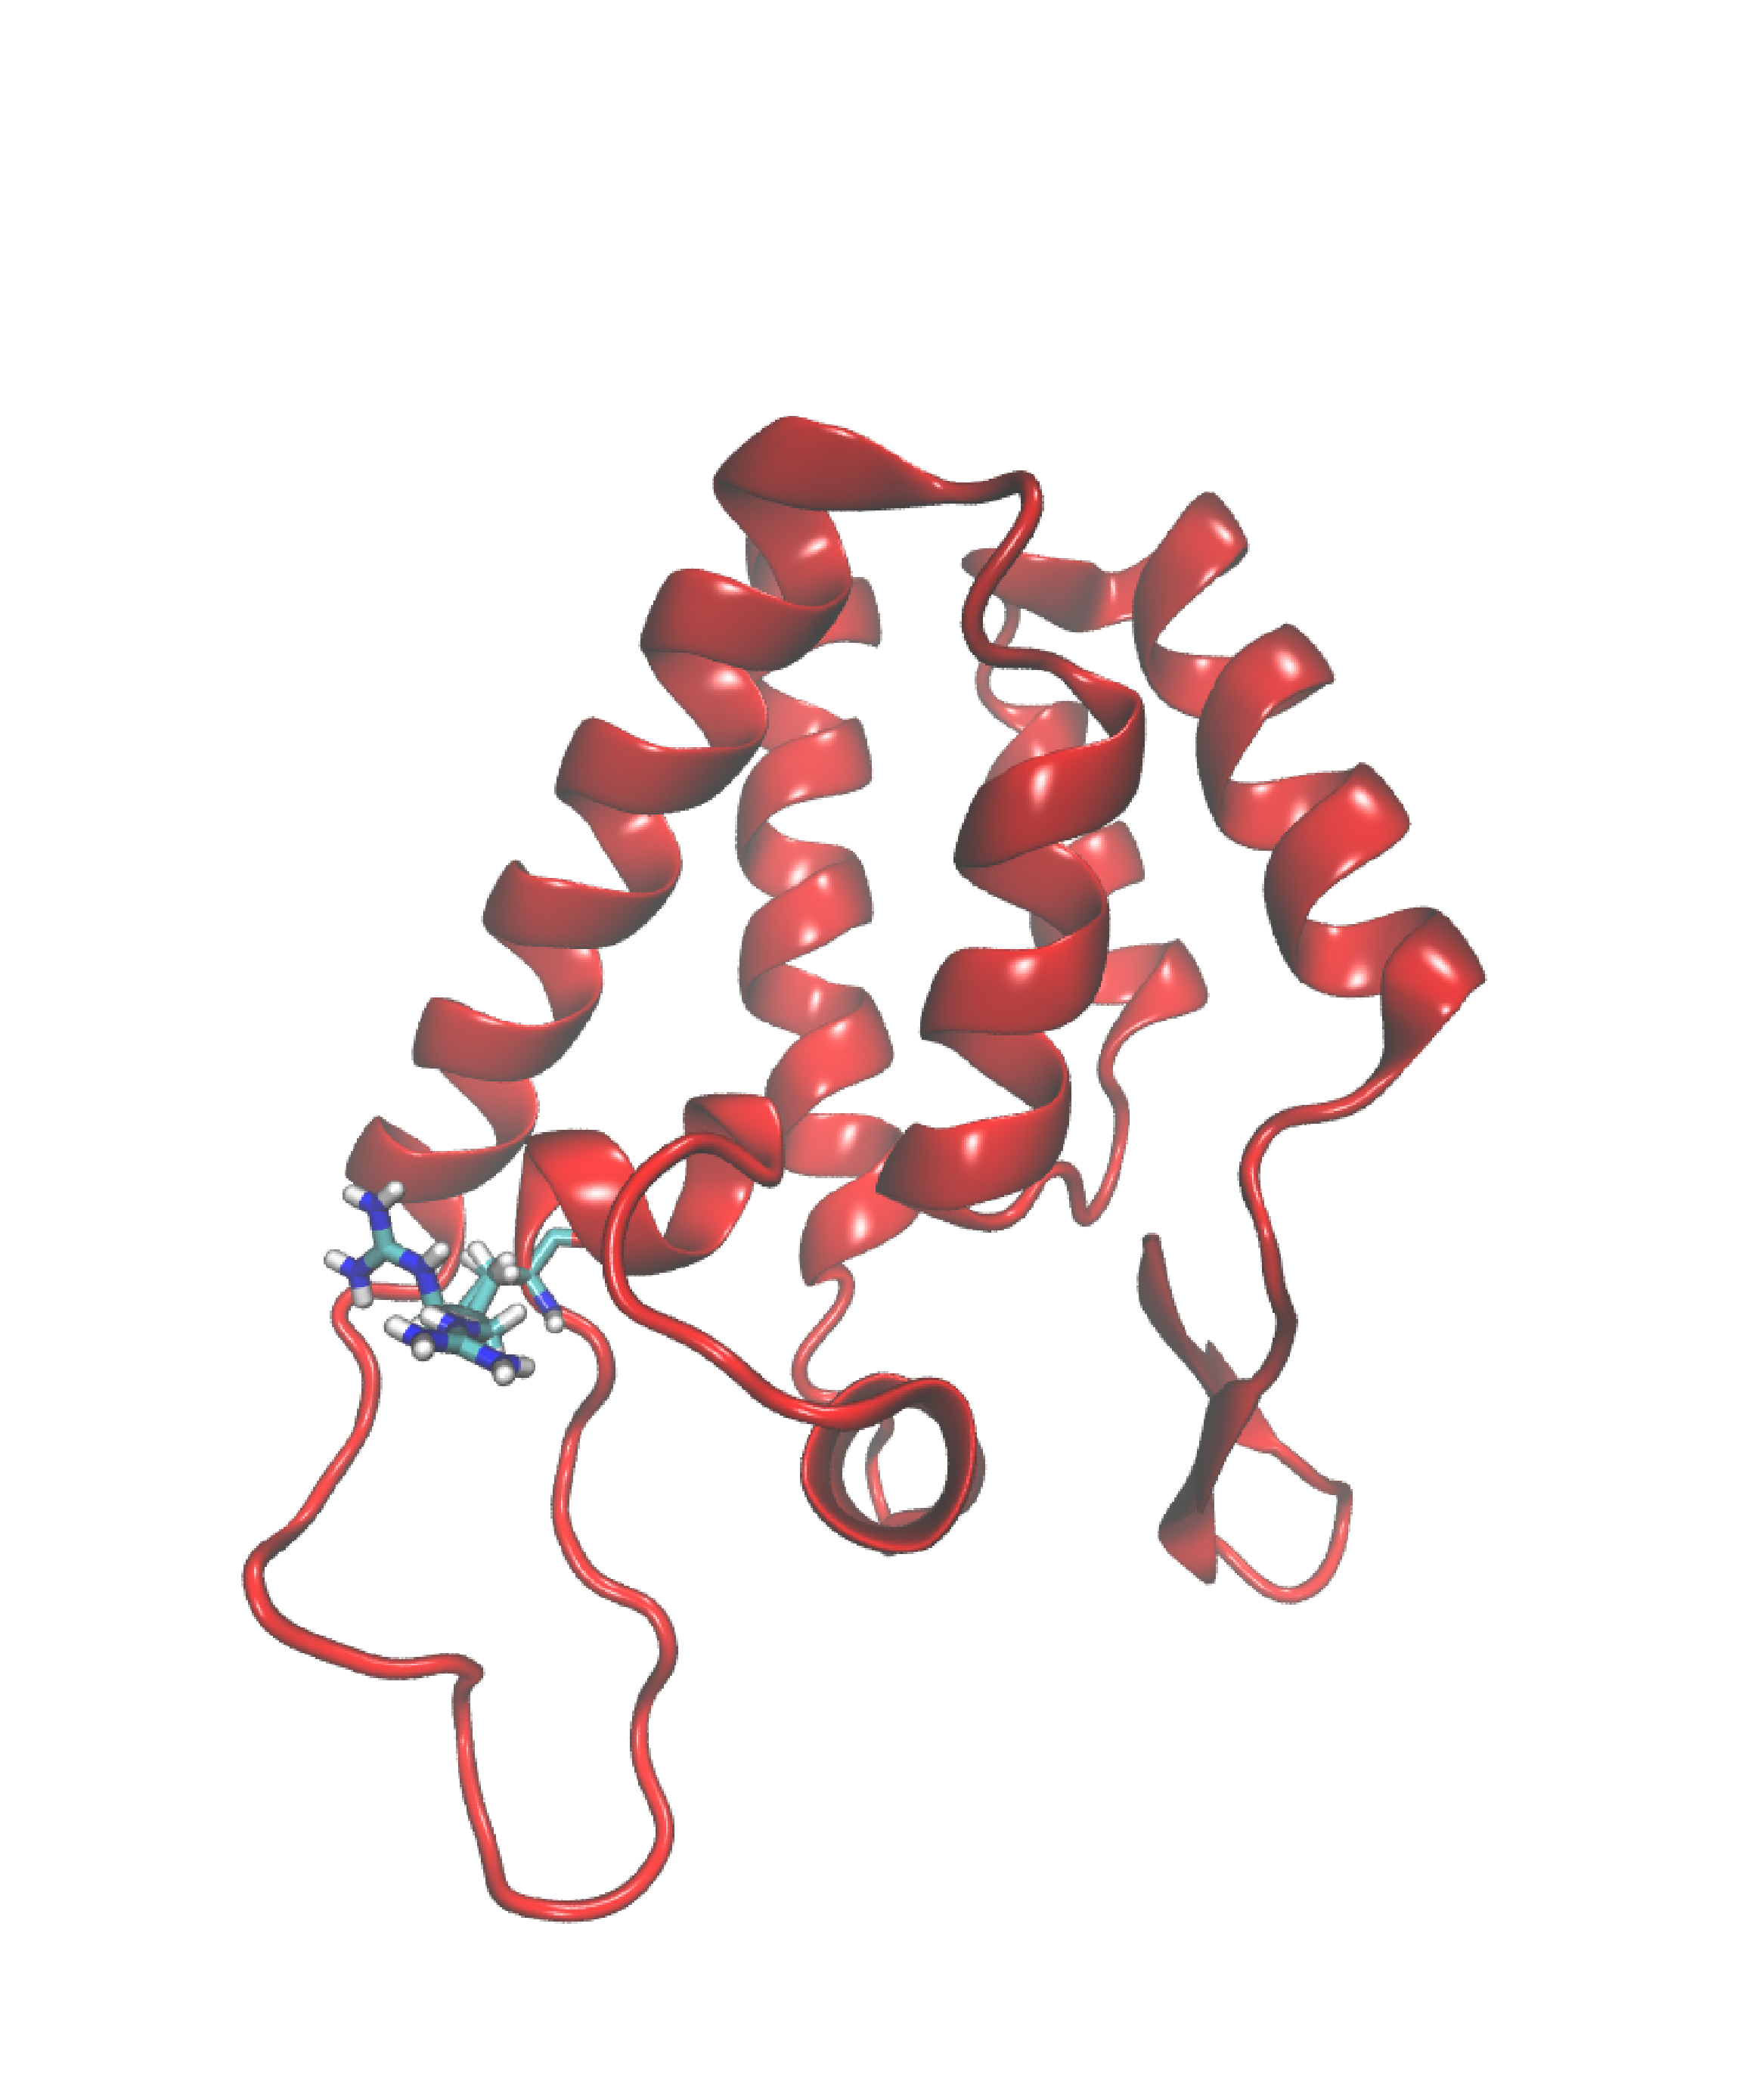
So let’s say that you want to modify the representation of residue 100 to a licorice style, coupled with a color scheme based on atom names. Here’s a step-by-step guide to achieving this tailored modification:
-
Selection of Residue 100: Begin by selecting residue 100. Execute this by typing
resid 100. This command generates a new selection, specifically isolating residue 100 from the rest of the molecular structure. -
Creating a Modified Selection: With residue 100 now selected, a new subset is established. This subset can be further customized to your liking.
-
Adjusting the Drawing Method: Navigate to the Drawing Method section and choose the representation style you desire. In this case, opt for the licorice representation to visually emphasize residue 100.
-
Fine-Tuning Coloration: Proceed to the Coloring Method section and select the color scheme based on atom names.
After implementing these modifications, observe the transformation in the visual representation. You should now discern a clear distinction between residue 100 and the remainder of the molecular structure, something resembling the image below.