Scripting in PyMOL: A Comprehensive Guide for Beginners
In this article, we will explore the techniques for scripting in PyMOL to automate tasks and optimize image generation workflows.
We will go through two distinct methods for scripting. The first employs pml scripting, a dedicated language for PyMOL, while the second leverages the versatility of Python within PyMOL.
This guide offers a basic idea of the syntax involved in writing a PyMOL script, along with the steps required to run it effectively. Furthermore, practical examples are included to illustrate the potential applications of scripting.
I will assume that you are familiar with some of the basic concepts in PyMOL. If you’re not, here are some articles that you might find interesting:
You can always refer to these articles if something in the scripts remains unclear.
Let’s jump right in.
Why scripting in PyMOL?
Imagine creating the perfect image, only to realize you didn’t save it, or you need to recreate it with minor adjustments.
Without a saved PyMOL session, retracing each command can be a challenging task, leaving room for error. That’s the reason why the number one advice for people using PyMOL is to write scripts, as these allow for 100% reproducible figures that are portable. This grants you the ability to automate repetitive tasks, save time, and facilitate collaboration by sharing your scripts with others.
Moreover, making minor alterations becomes a straightforward process. Simply modify the script and run it, that’s all that it takes.
How to Create and Run a PyMOL pml Script
Now let’s see how to work with scripts in practice. Creating a script in PyMOL is really easy. All you need to do is create a new text file in the .pml extension. For instance:
|
|
Then you can enter the file and write a sequence of PyMOL commands that will adjust the view and appearance in the way that you prefer.
Once you have done this all that is left to do is to run the script from the command line. If the script is in the same directory as the one you opened PyMOL in, then you can use:
|
|
Otherwise, you can simply specify the entire path for the script (path/to/script)
|
|
Executing this command will carry out the instructions you’ve written in the script, following the specified order.
With this knowledge in hand, let’s explore some practical examples.
Script in PyMOL: Examples
Example 1: Basic Script for Image Rendering
In this first example, we will start with a straightforward script that introduces you to what a basic script might look like. Below is the script:
|
|
As you can see, this is nothing but a series of PyMOL commands assembled in a unique text file.
This script performs the following steps:
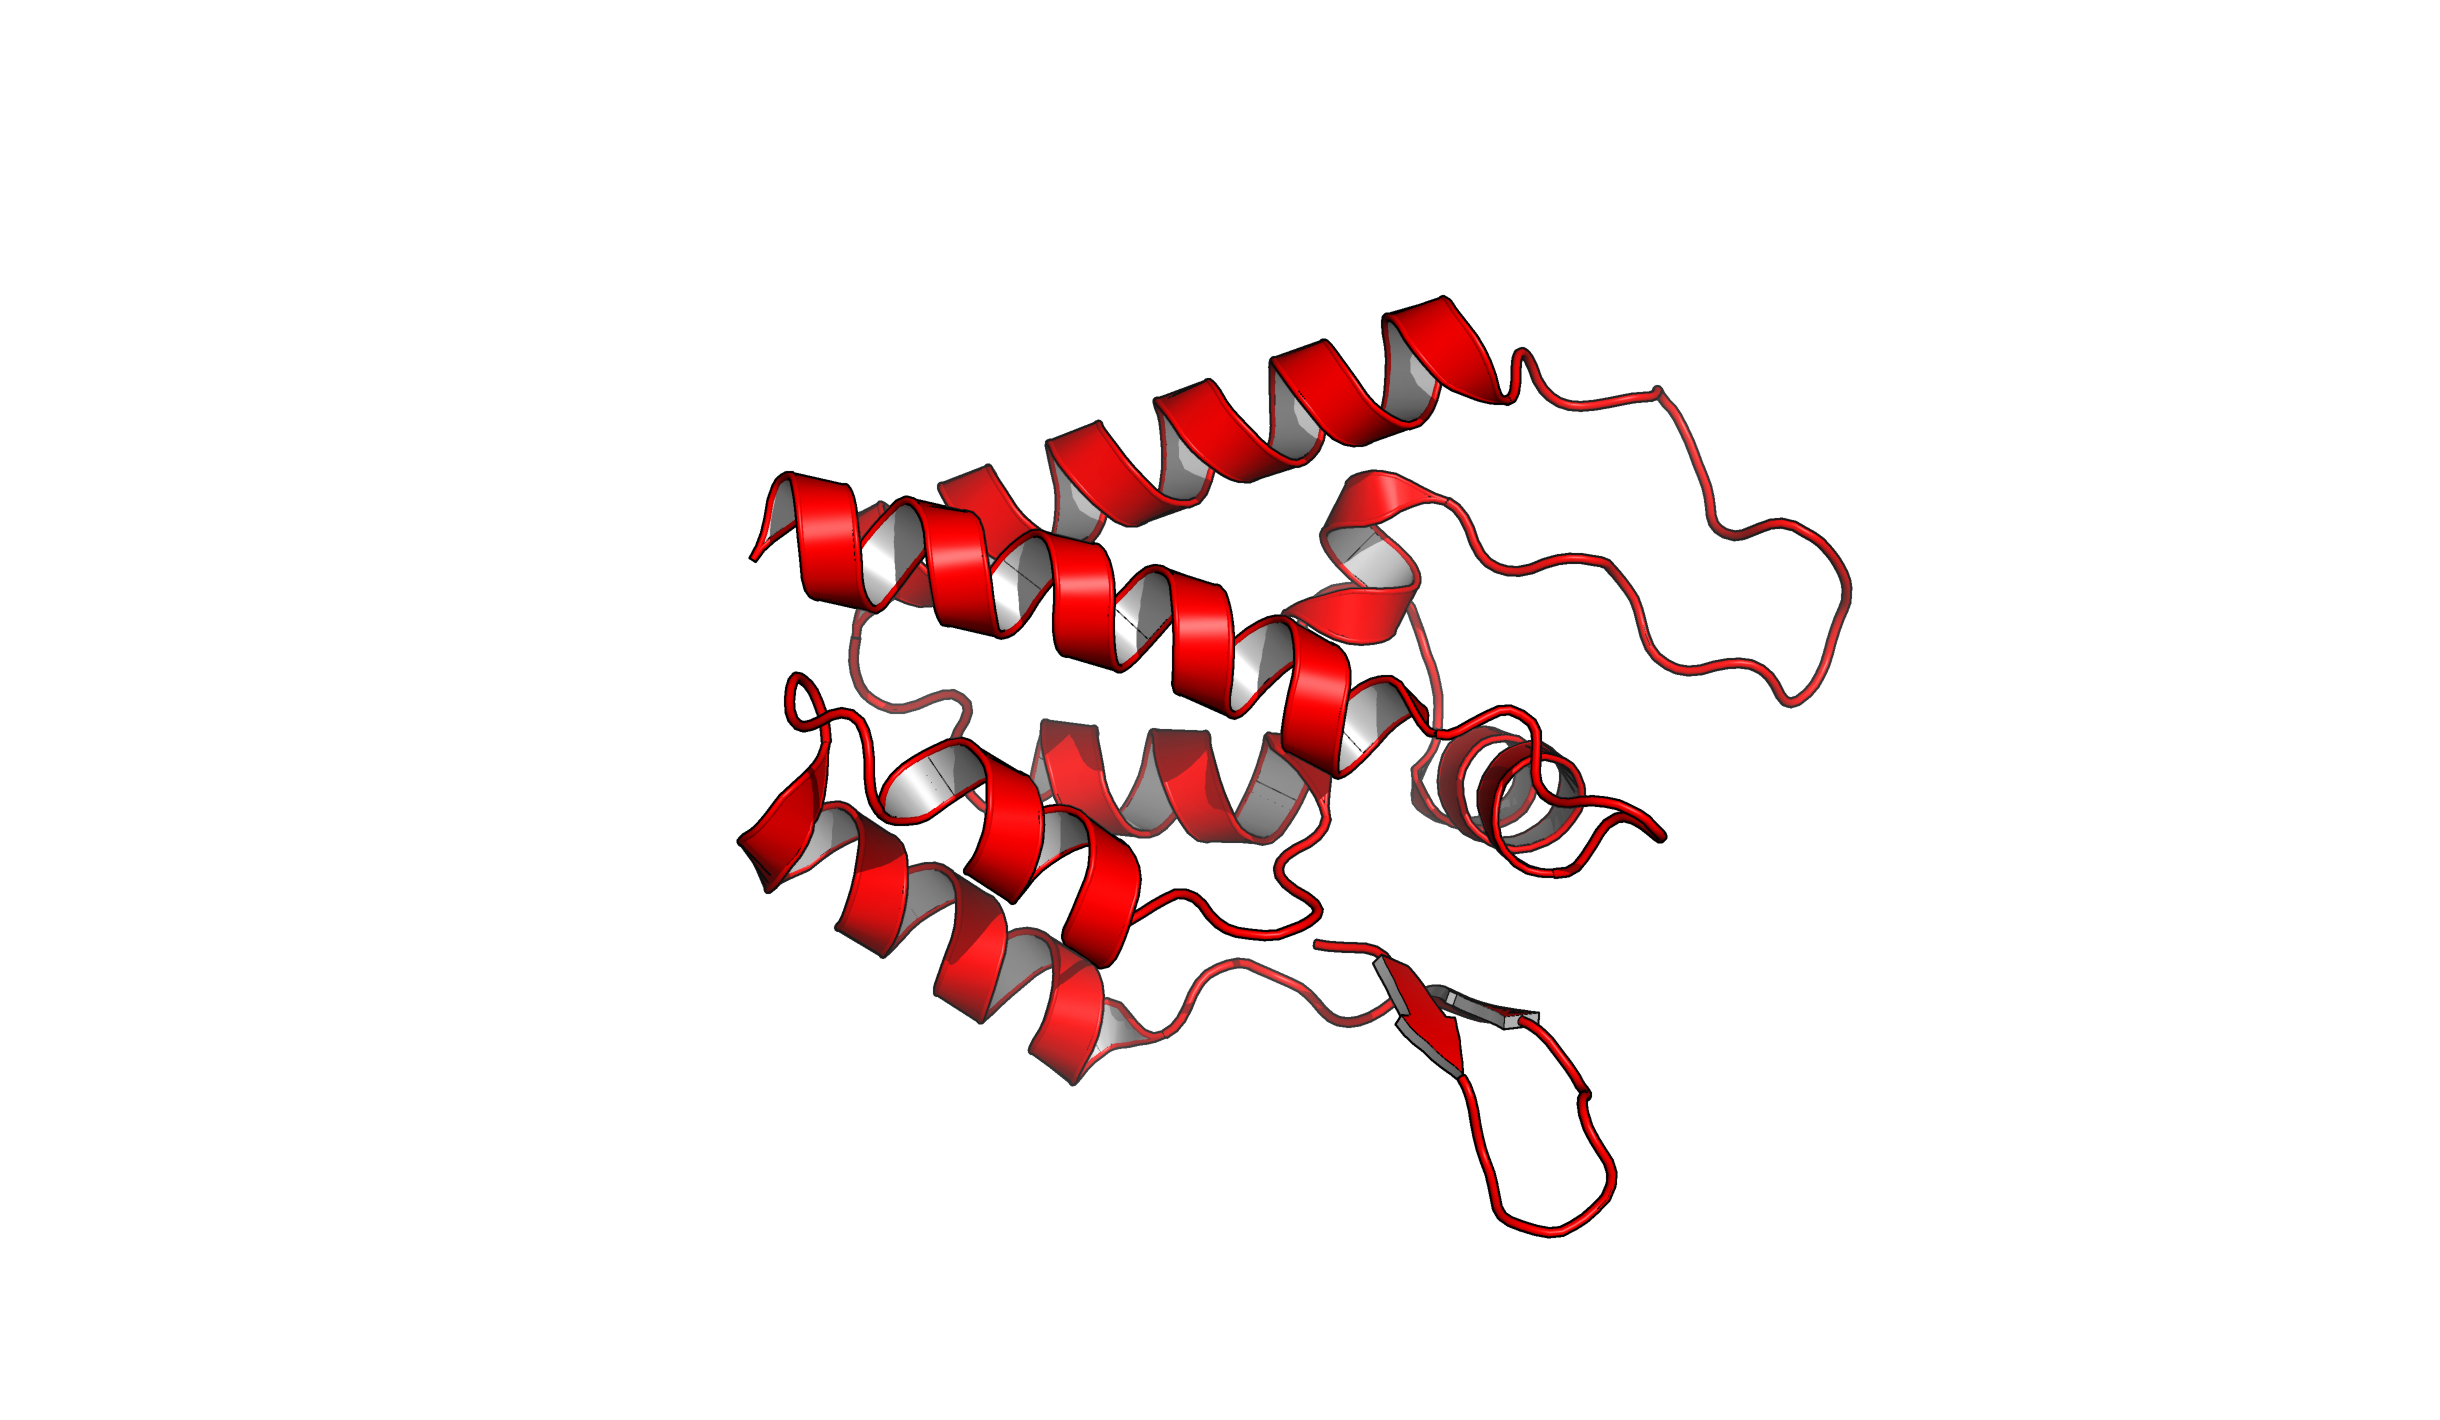
- Fetches a structure from the Protein Data Bank (PDB) and orients it.
- Modifies the representation of the protein by hiding all and showing a cartoon representation.
- Colors the cartoon representation in red, and enhance the helices with a fancy style, along with an inner color of a light grey shade.
- Changes the background color to white.
- Renders an image with high-quality ray tracing and saves it as
example_1.pngwith a resolution of 300 DPI.
Feel free to create a text file (example_1.pml), paste this script, and run it in PyMOL to observe the results. This is what you should see:
Example 2: Script for Analysis and Visualization
Let’s explore another practical scenario.
Imagine you’re simulating interactions between a protein and a ligand. There’s a good chance you’ll often find yourself opening the structure file to track their changes during the simulation. Additionally, you might want to highlight the binding pocket, perhaps the sidechains of the residues within a radius of 5Å the ligand.
To streamline this process, consider creating a script. This way, you won’t have to repeatedly enter the same commands each time you open PyMOL. It offers a more convenient and efficient approach to handling this routine analysis.
|
|
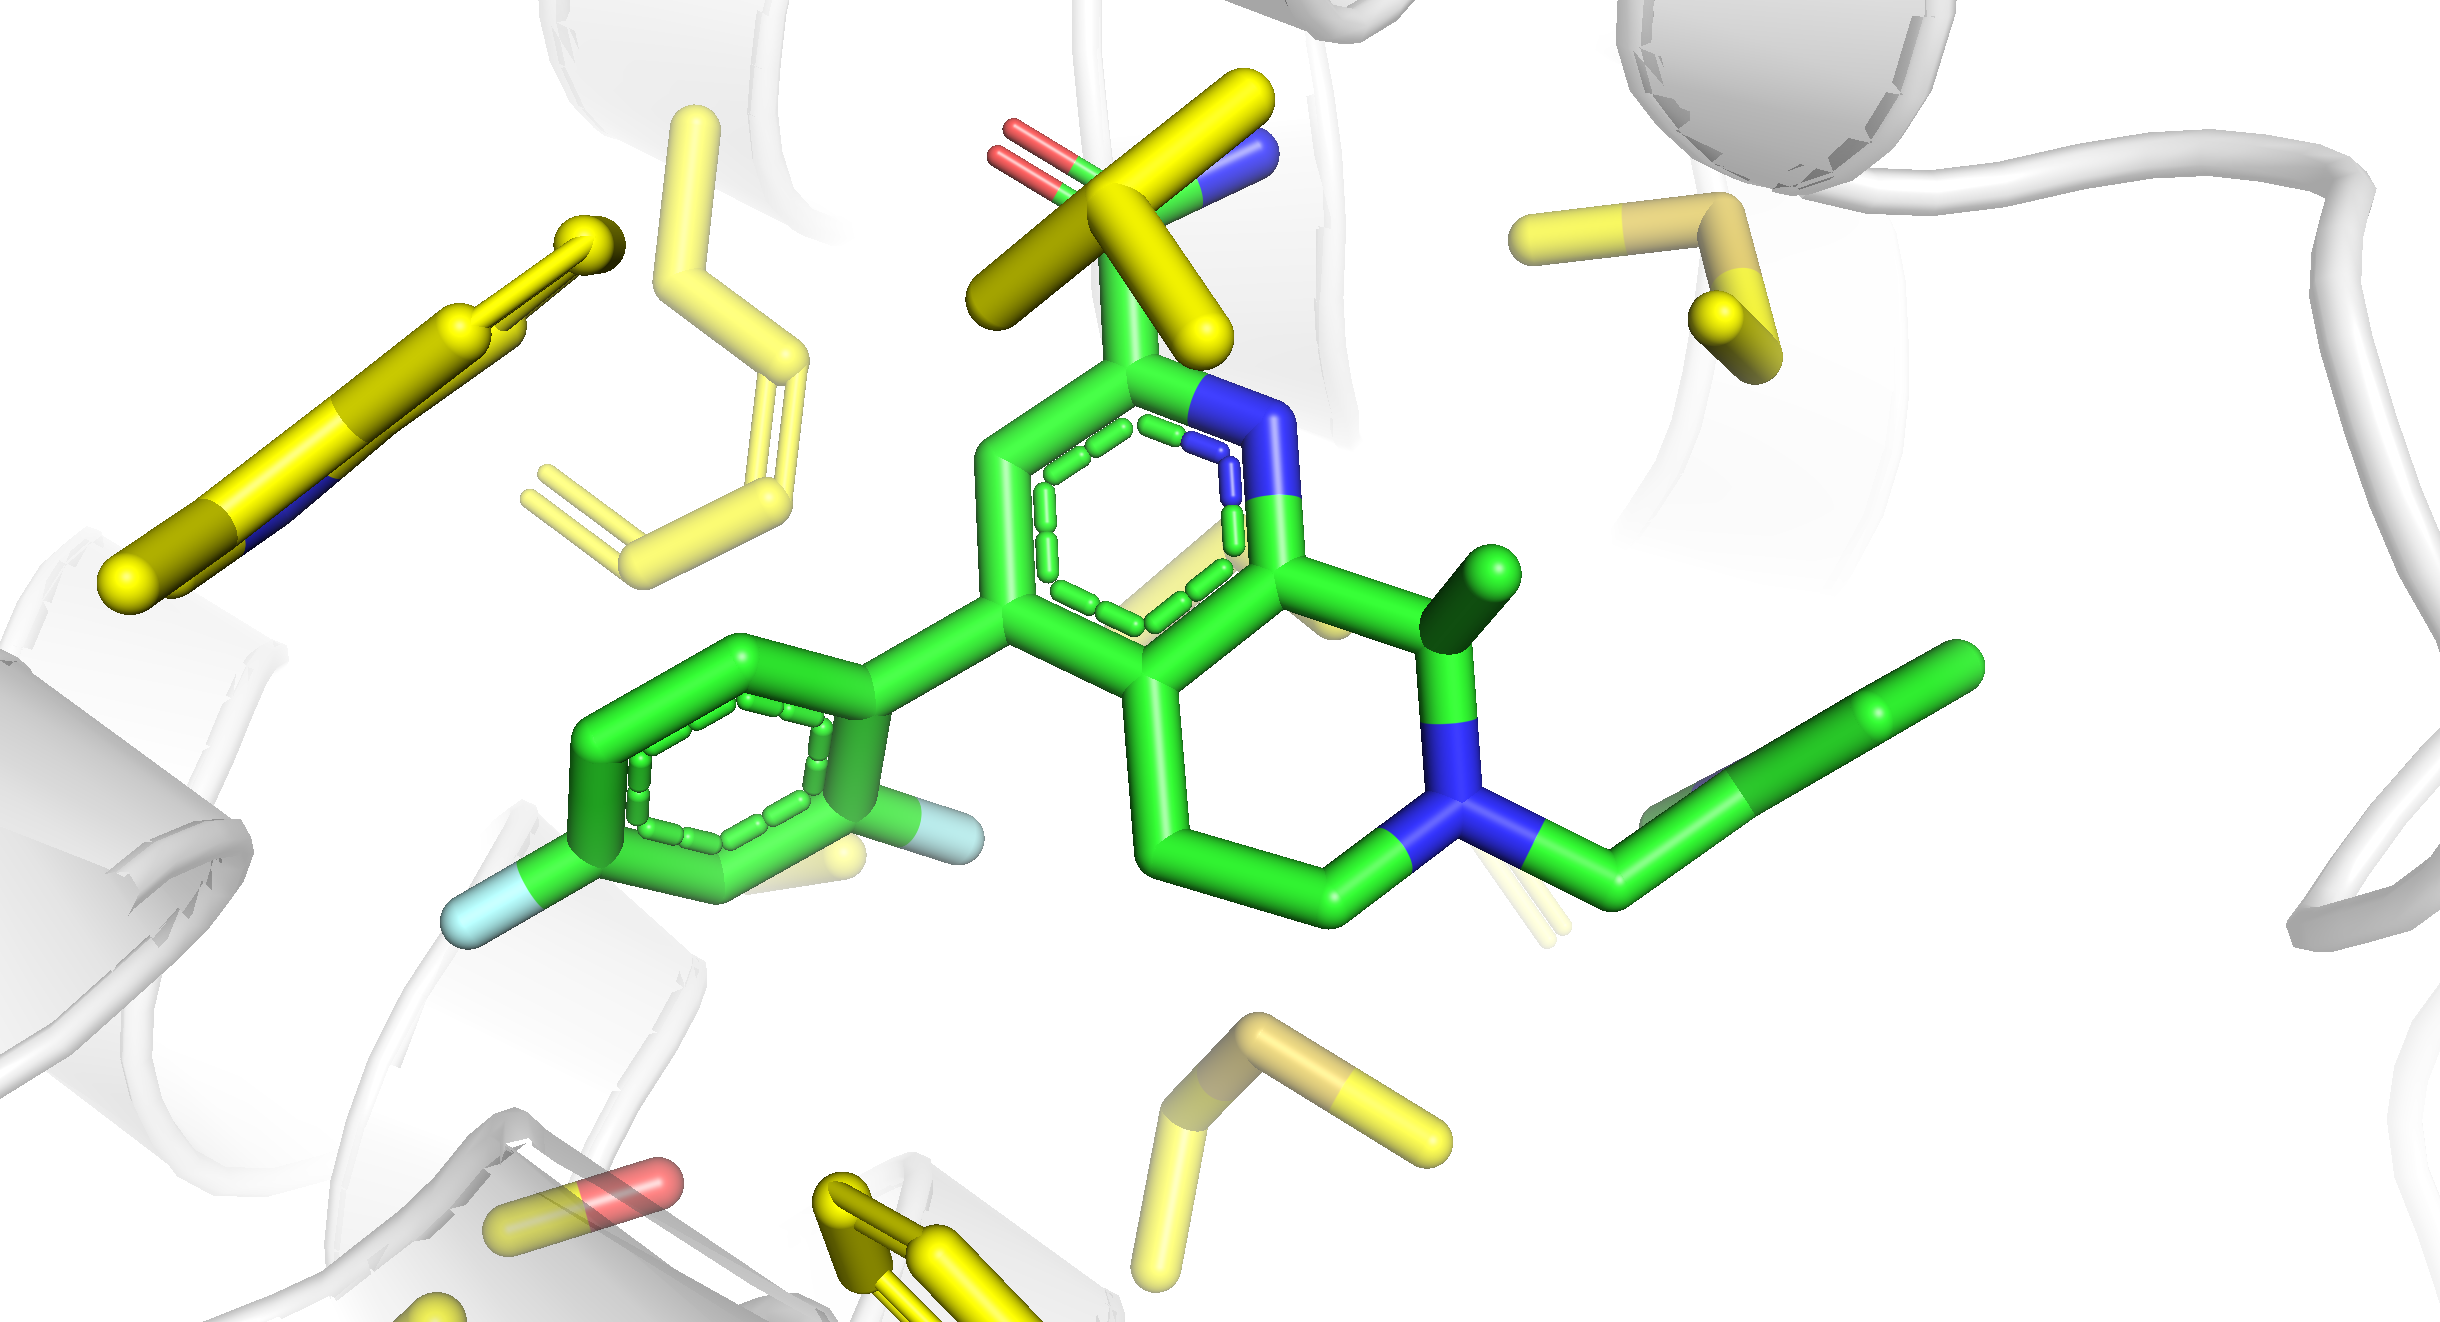
This script performs a series of commands in PyMOL to visualize a protein structure (PDB ID: 7EPF) and customize its appearance, as well as highlight a specific ligand and its surrounding side chains.
- Fetch the structure from PDB. You can also load it from your local machine with the
loadcommand.
fetch 7epf: This command fetches and loads the protein structure with the PDB code ‘7epf’.
- Set the background color to white and hide eventual solvent molecules.
bg_color white: This sets the background color of the PyMOL viewer to white.hide solvent: This command hides the solvent molecules, making them invisible in the visualization.
- Customize protein appearance
set cartoon_fancy_helices: This command enhances the appearance of helices in the protein’s cartoon representation.set cartoon_color, hydrogen: This sets the color of the cartoon representation to white.set cartoon_transparency, 0.6: This adds a level of transparency (0.6 or 60%) to the cartoon representation.
- Customize ligand appearance:
util.cbag resn J9U: This command customizes the appearance of the ligand with the residue name ‘J9U’.
- Select and customize the binding site:
select bs, sidechain within 5 of resn J9U: This command selects the sidechain atoms within a 5 Åradius of the ligand with residue nameJ9Uand assigns them to a selection namedbs(binding site).show sticks, bs: This displays the atoms in the binding site as sticks.util.cbay bs: This applies a specific color scheme to the atoms in the binding site.deselect: This clears the current selection.
- Orient the protein to set the view:
orient resn J9U: This orients the view to focus on the ligand with residue name ‘J9U’.
This should be the final result:
The provided script serves as a starting point, but feel free to modify and tailor it to suit your specific needs.
For instance, you could measure distances between specific atoms, as demonstrated here, so that you can highlight particular interactions like hydrogen bonds.
Also, if you find a specific perspective that you like you can use the get_view. This will print a specific view in the command line. Like this:
|
|
As explained in the output, you can copy and paste it to your script to make sure that the next time you will have that exact view.
Create and Run a Python Script in PyMOL
The second option involves using Python.
As mentioned in the introduction to PyMOL article, PyMOL allows you to use Python directly. This means you can write and run Python code right in the console.
This can be particularly useful for analysis, but it does require some familiarity with Python programming. If you’re already comfortable with Python, you’ll find the built-in PyMOL package to be a useful addition.
Here I will give you a very brief introduction.
To keep things simple, let’s revisit the first example we discussed earlier and see how it translates to Python. Start by creating a Python script file, let’s call it python_example.py, and write the following code:
|
|
As always, you can run it with:
|
|
The final result will be the same as previously shown.
This approach essentially brings together the capabilities of PyMOL and Python, enabling you to achieve a wider range of tasks. Your proficiency in Python is the only limiting factor.
Example: Running a script from the Script Library
If you’re new to writing Python scripts for PyMOL, consider checking out the PyMOL Script Library. It contains a collection of pre-written scripts that you can freely use.
For instance, let’s say you want to use the bbPlane.py script, which you can download here. This script draws a plane between the backbone atoms of two neighboring residues.
After downloading the script, open PyMOL and run it using the following command:
|
|
This will add a new command named bbPlane to PyMOL. Now, if you load a structure, you can simply use this command to utilize its capabilities:
|
|
|
|
Now you should see the planes drawn on the protein.