VMD Measurements: Analyze Distances and Angles with VMD
As a computational chemist, you will often encounter the need to extract valuable information from molecular structures or trajectories.
One common task involves measuring bonded interactions such as distances and angles between atoms, which can provide crucial insights into the structural changes and interactions within a molecular system
While we have previously explored various tools and methods for achieving this, here we will shift our focus to the capabilities of VMD
In this guide, you will learn how to navigate through the VMD interface (which can be confusing at times) to measure distances and angles between atoms in a static structure.
VMD also offers the possibility to track how these features change along the course of a simulation. So if you’re unfamiliar with this software, be also sure to check out the tutorial on how to load a trajectory in VMD.
Distance measurements in VMD
VMD comes equipped with a range of convenient predefined hotkeys, allowing for efficient actions.
To initiate the distance measurement process, we can utilize the handy pick a bond mode by pressing 2 on your keyboard. This mode enables us to interactively select the atoms of interest.
Once in the pick a bond mode, select the two atoms you wish to measure the distance between. Instantly, VMD will display the labels of the selected atoms as well as a dotted line connecting them, and the corresponding distance value (in Å).
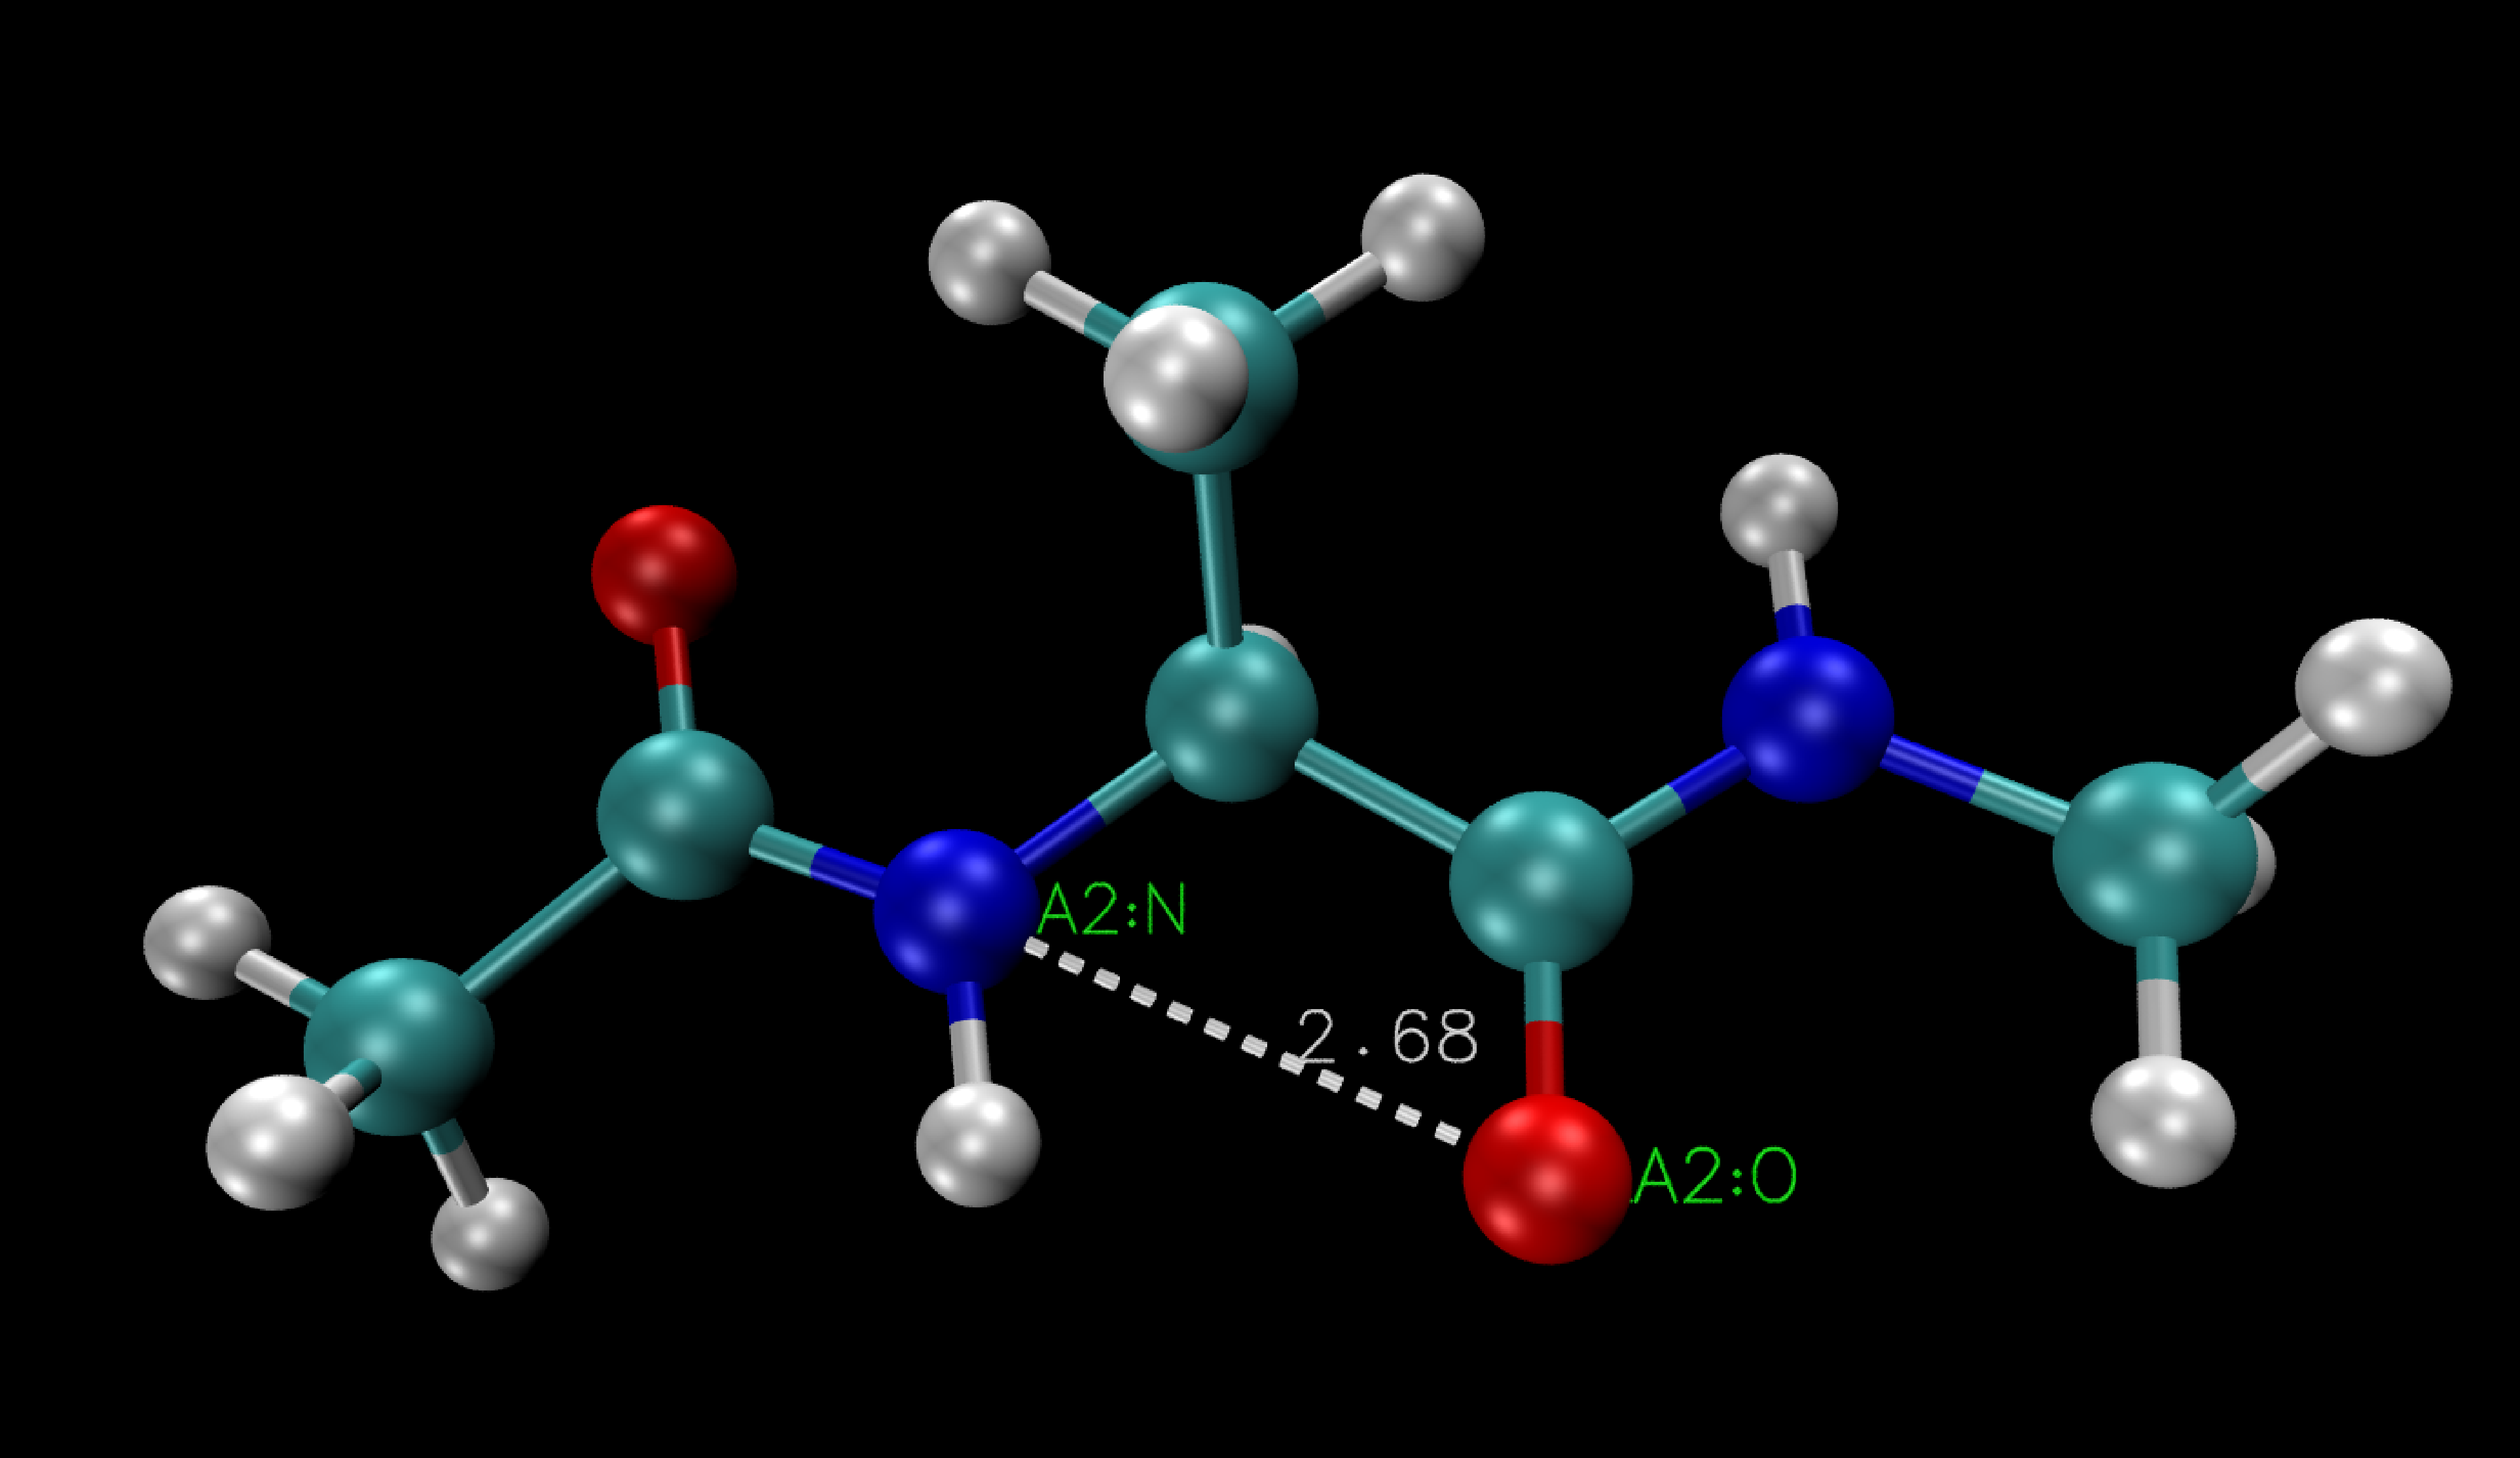
Here the distance between the Nitrogen atom (A2:N) and the Oxygen (A2:O) is 2.68Å.
Now if you play the simulation you will notice that the distance value will start changing accordingly.
Simplifying Your VMD Display: Removing Labels
Labels can be annoying. if you want to remove them you can open the Label panel by clicking on:
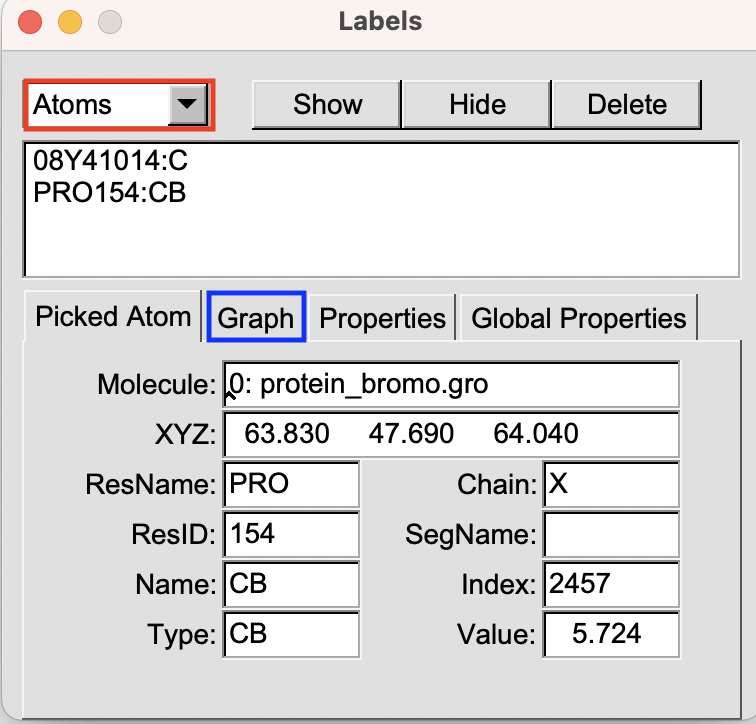
Within the Label panel, by default, you will be shown the Atoms labels. You can select the ones you wish to remove and click on Delete. This action will eliminate the selected atoms labels from your VMD display.
Similarly, you may also want to remove bond labels. To achieve this, access the Bonds section located in the upper left panel (Red box in the image). Within the Bonds section, select the bond label you want to delete, and click on Delete. This action will remove the bond label.
Tracking distance during the simulation
If you want a more quantitative way to analyze how the distance between the two selected atoms varies during the simulation you can still take advantage of the Label panel.
From here, you can select the bond you want to observe and then click on (Blue box in the image):
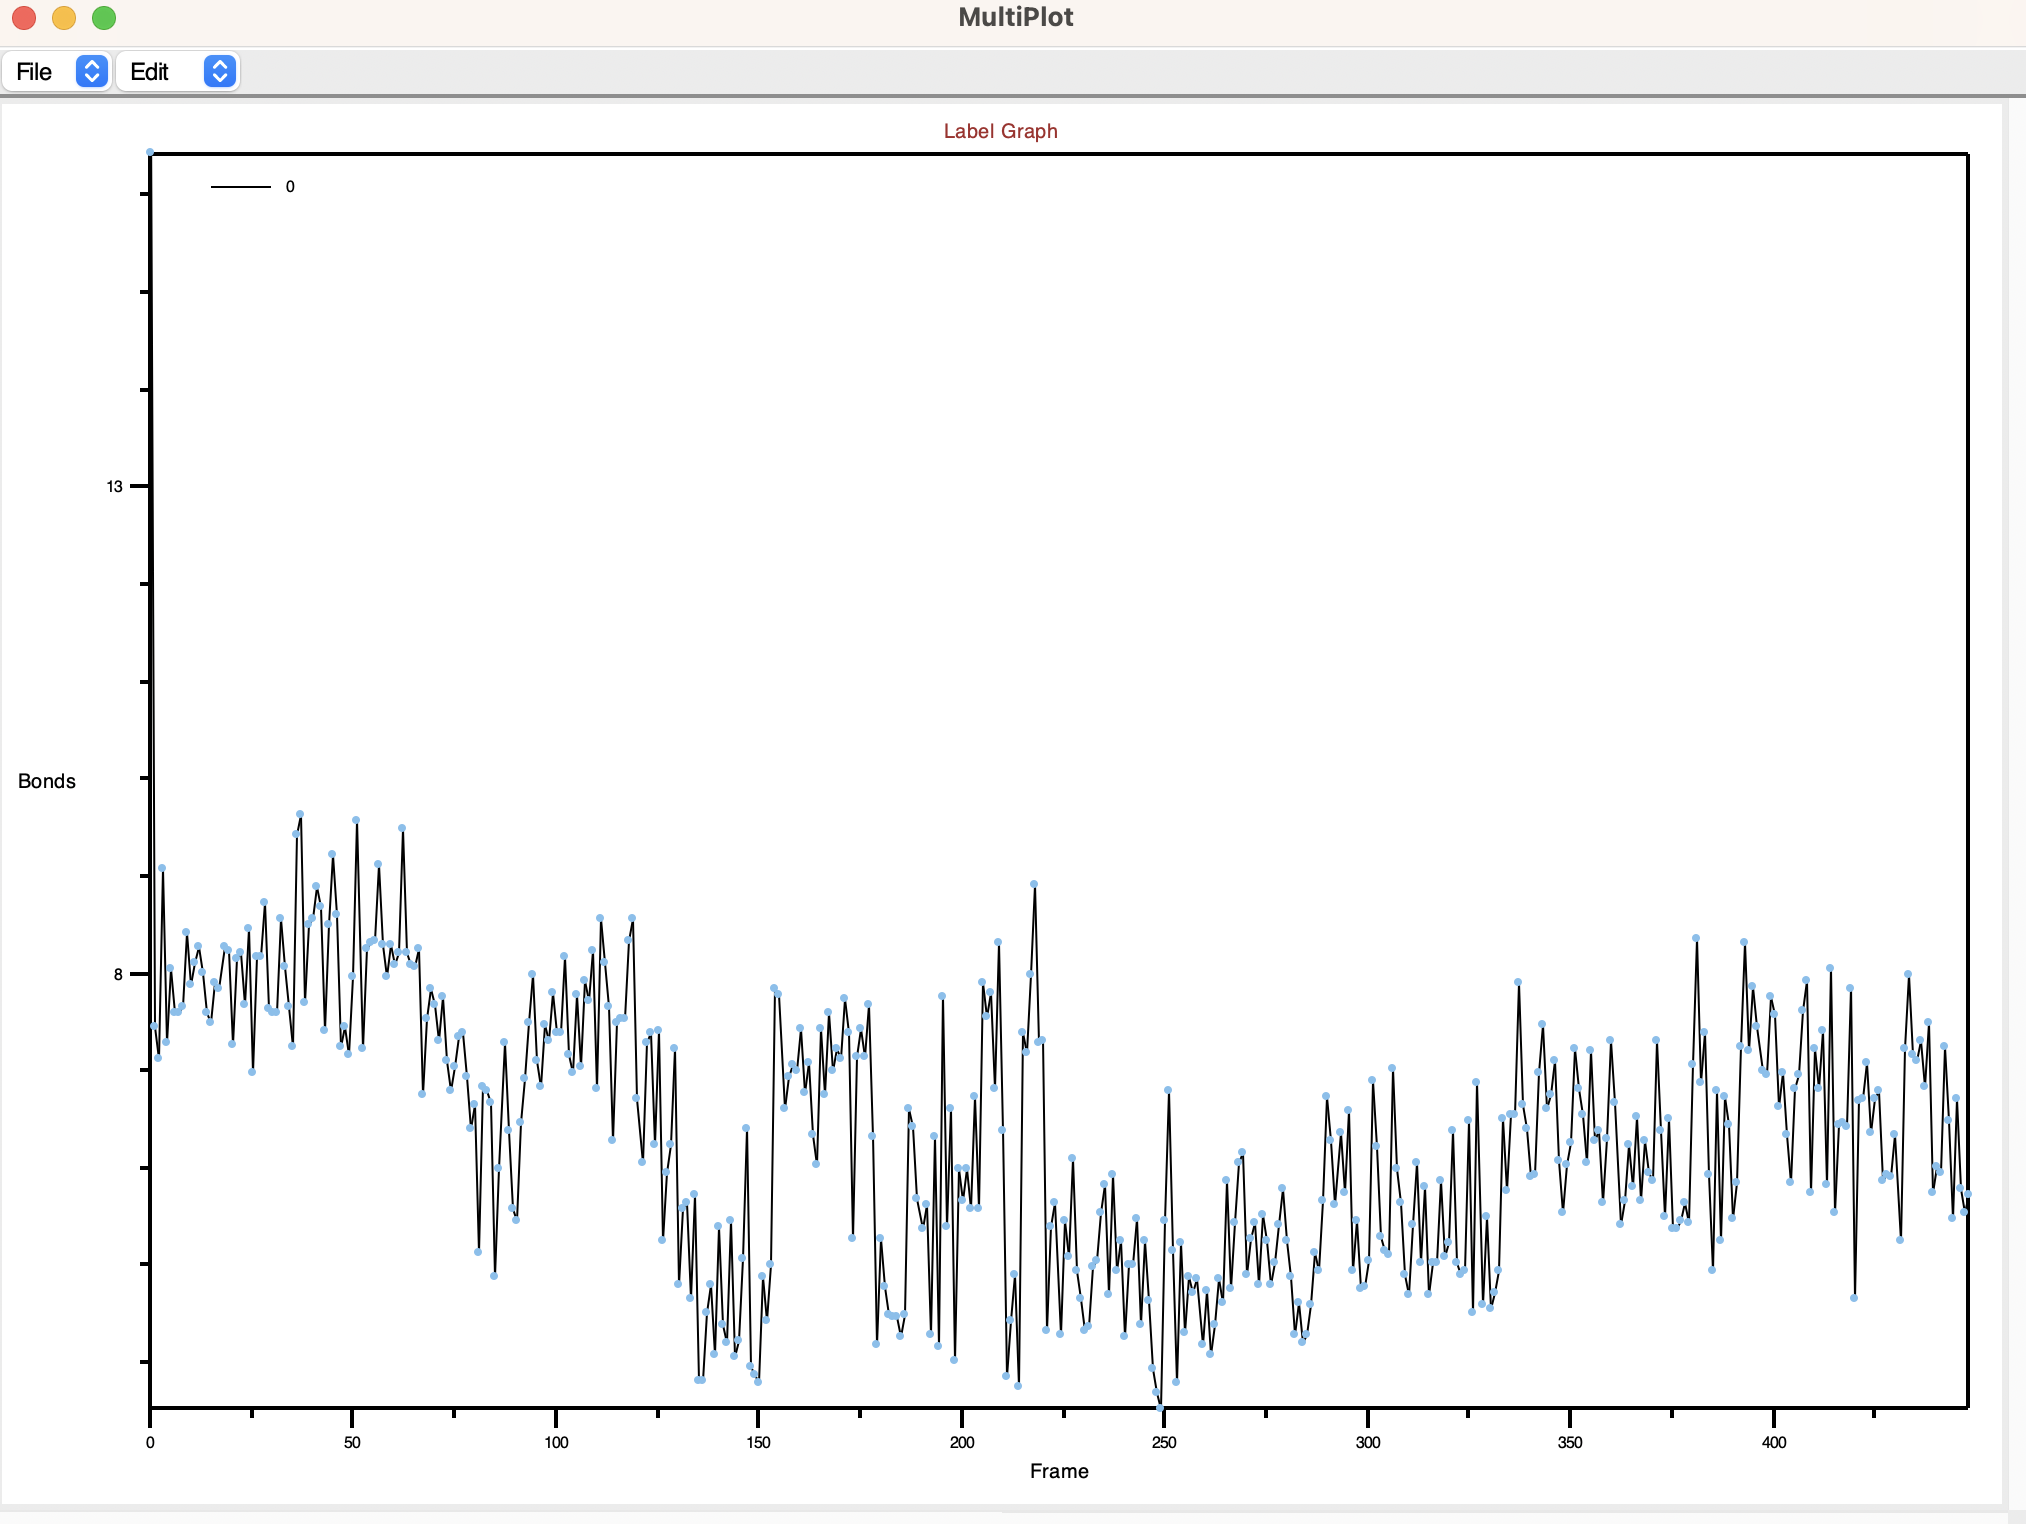
Upon activation, a graph will be displayed, illustrating how the bond distance changes across different frames in your trajectory.
To further customize the plot, VMD allows you to save the data by clicking on the Save option. Choose the desired directory and file name to save the data.
The resulting file will show something like this.
|
|
Where the first column is the frame and the second one is the distance.
Once saved, you can utilize your preferred plotting tool (such as Grace or Python) to create customized visualizations based on the data.
Angle measurements in VMD
Now we will go through the other measurements you can perform with VMD. The basic idea is very similar to the previous one I showed so I will go quicker.
To initiate an angle measurement in VMD, you can enter the pick an angle mode by simply clicking 3 on your keyboard.
Once in this mode, you can select the three atoms involved in the angle of interest. As a result, VMD will display a label for each of the three atoms, along with the corresponding angle value.
To illustrate this process, consider the example depicted below, showcasing the measurement of the angle between three carbon atoms (A2:C, A2:CA, A2:CB) in alanine dipeptide using VMD.
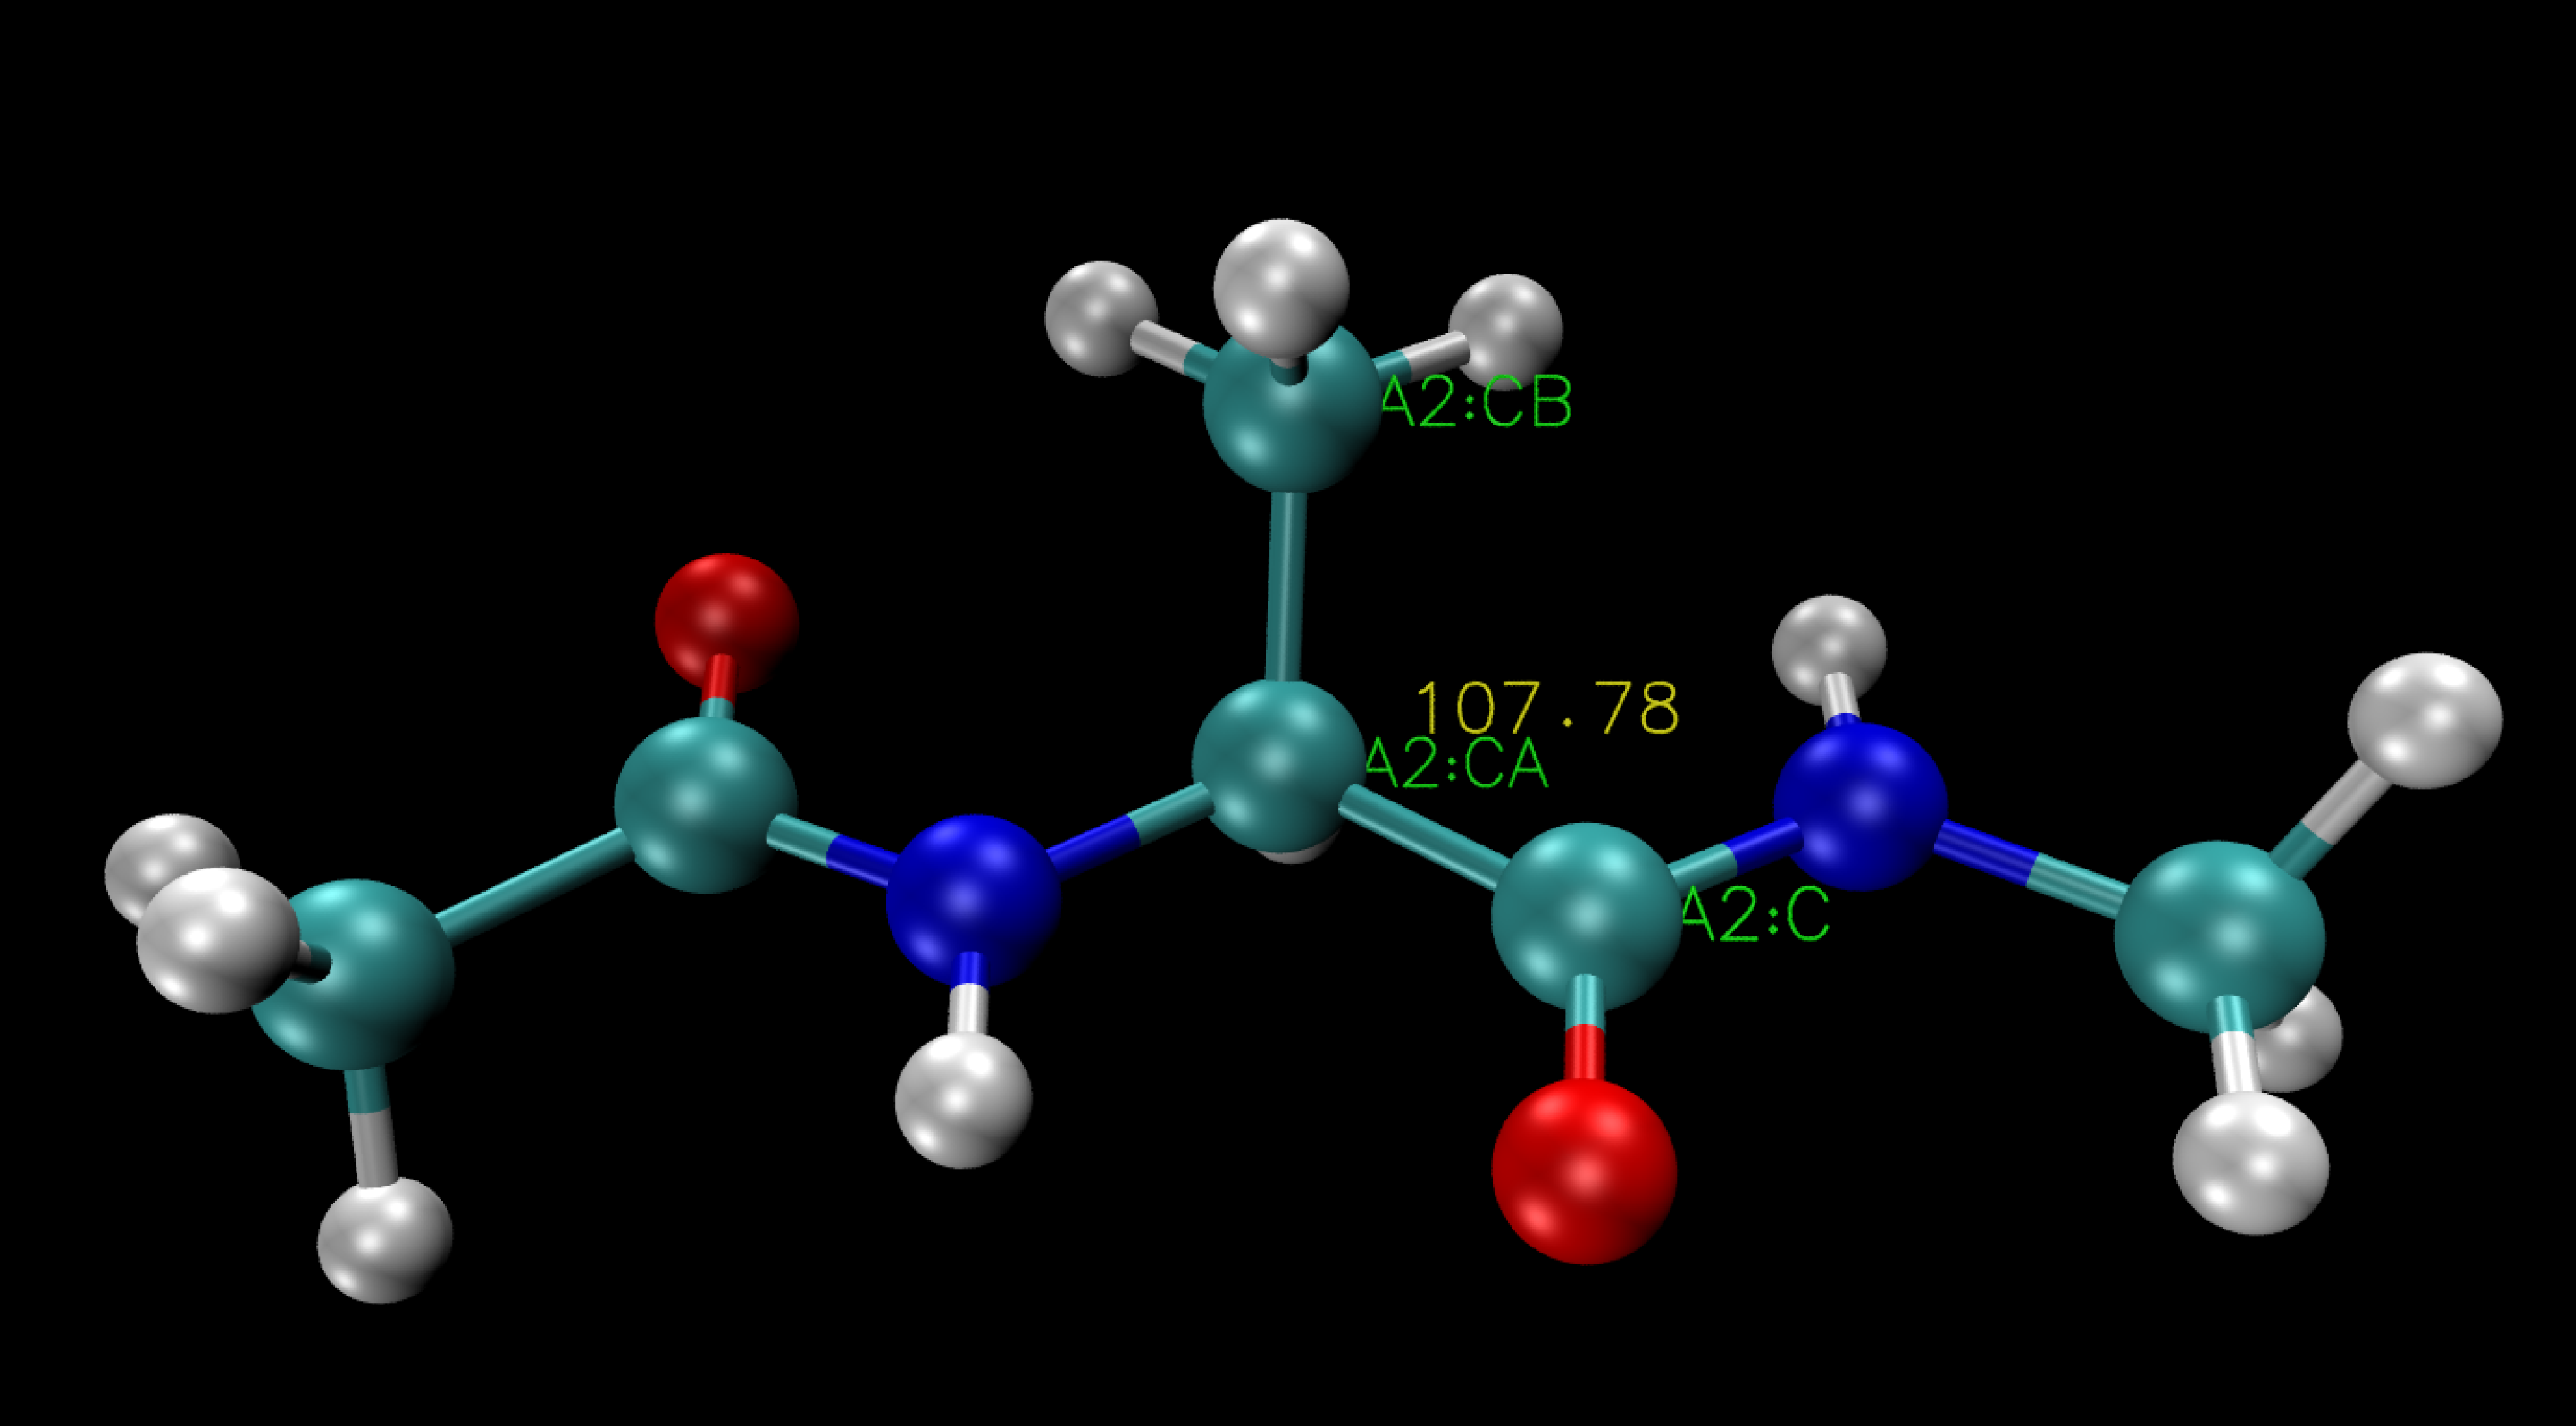
Here the angle three carbon atoms (A2:C, A2:CA, A2:CB) is 107.78°.
Similar to distance measurements, you can utilize the labels menu to remove any unnecessary labels and optimize your visualization.
You can also use it to plot the evolution of the angle along the course of the simulation which should display a graph similar to the one reported above.
Dihedrals measurements in VMD
Finally, let’s delve into dihedral measurements, an essential tool for understanding the conformational changes and torsional movements within a molecular system.
To begin a dihedral measurement in VMD, enter the pick dihedral mode by pressing 4.
This mode allows you to select four atoms involved in the dihedral angle you want to analyze. VMD will then display labels for each of these atoms, along with the corresponding dihedral angle value.
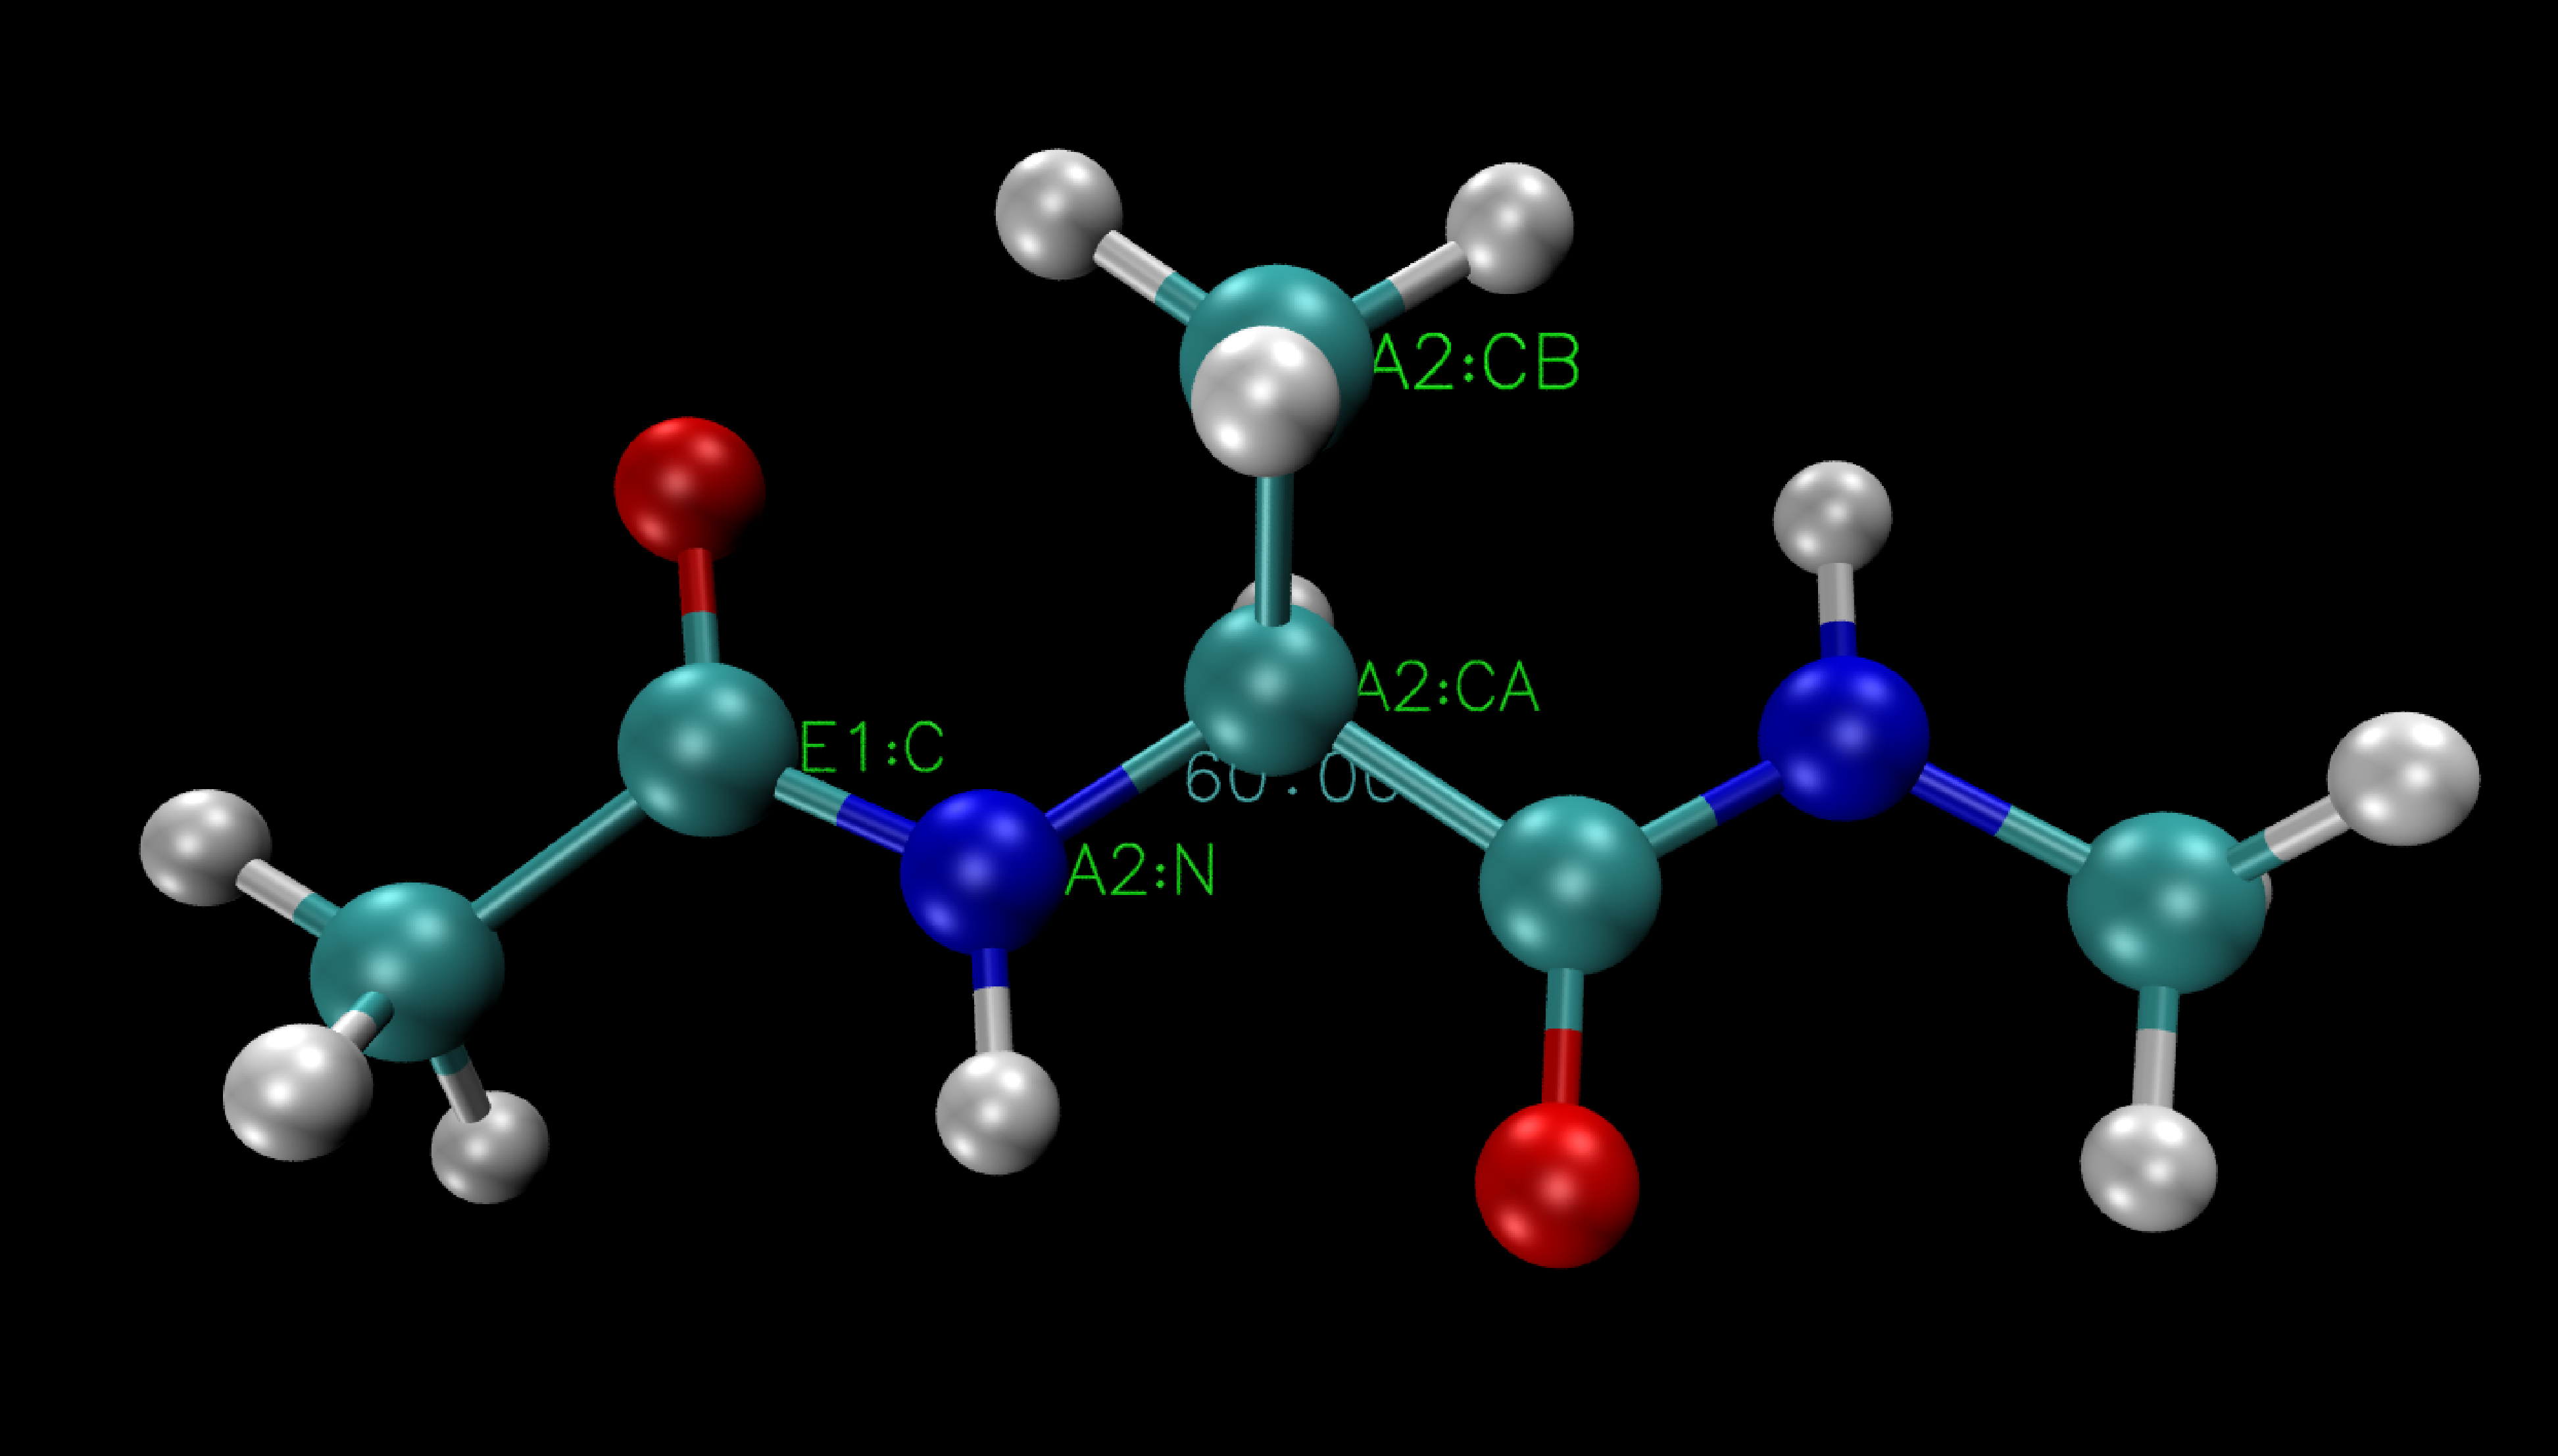
Here the dihedral between the four selected atoms is 60°.
Similarly to what we previously saw you can access the labels menu.
Also in this case, you can use the labels menu to remove any unnecessary labels and optimize your visualization. You can also use it to plot the evolution of the dihedral angle along the course of the simulation which should display a graph similar to the one reported above.